


There are multiple ways to add, open, close, and move plot windows:
The following Show-Me animations are presented as an animated GIF in the online help. If you are reading the PDF version of the help and want to see the animated GIF, access this section in the online help. The interface shown may differ slightly from that in your installed product.
To add a new plot window, drag the plot from the Visuals pane to the plot display area.
To move a plot, click the window and drag it to a new position in the plot display area.
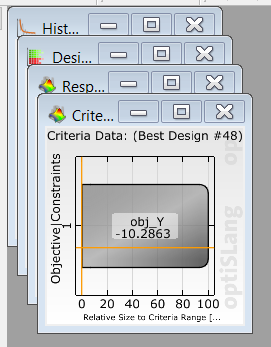
To cascade the plot windows, from the menu bar select > , or from the toolbar, click
 .
.
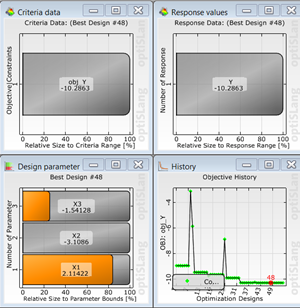
To tile the plot windows, from the menu bar select > , or from the toolbar, click
 .
.
To restore the plot layout to the state when the file was last saved, from the menu bar select > , or from the toolbar, click
 .
.To hide or re-display a plot window:
From the menu bar select > then select the plot to hide or display.
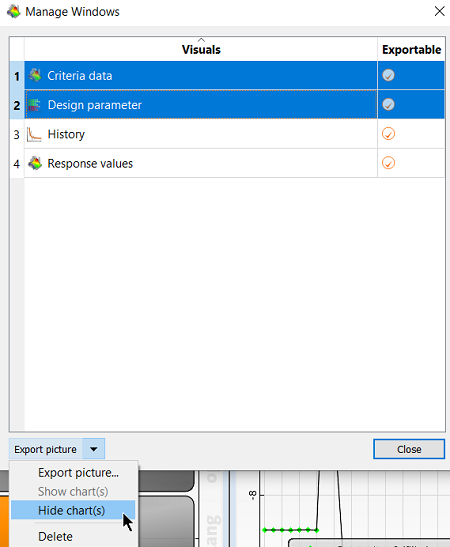
From the menu bar select > . Select one or more plots in the list, then select or from the multi-selection button.
To change the size of the plot window:
Click and drag the sides of the window to resize it.
To minimize the window, click
 .
.To restore the window after minimizing it, click
 .
.To maximize the window, click
 .
.