


This tutorial allows you to calculate a set of designs using the Metamodel of Optimal Prognosis (MOP) Solver in Excel.
This designs use the following analytical nonlinear function:
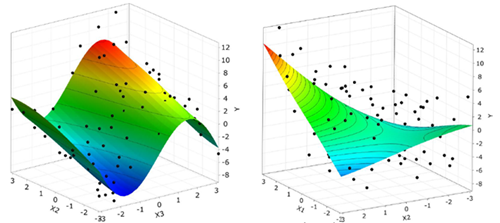

The function has additive linear and nonlinear terms and one coupling term.
Contribution to the output variance (reference values):
X1: 18.0%
X2: 30.6%
X3: 64.3%
X4: 0.7%
X5: 0.2%
Before you start the tutorial, download the excel_tools zip file from here , and extract it to your working directory. Also ensure that the optiSLang Exel Add-in has been installed.
To set up and run the tutorial, perform the following steps:
Start Excel.
On the Excel Ribbon, switch to the tab.
Click .
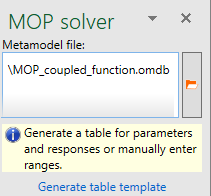
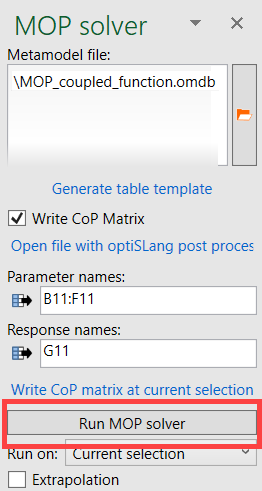
The MOP solver dialog box opens.

To the right of the Metamodel file field, click the orange folder.
Browse to the excel_tools folder and select MOP_coupled_function.omdb.
Click .
Select a cell for table generation. For example, A1.
Click .
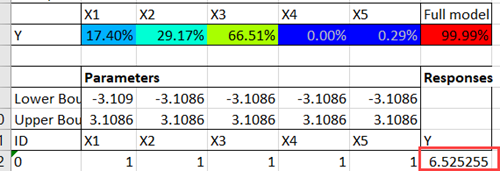
The design table is generated and displayed.
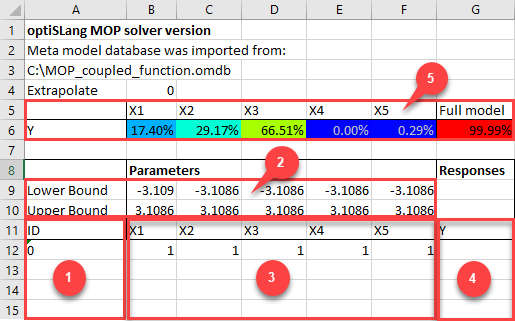
Number Description 1 Optional design ID 2 Lower and upper parameter bounds 3 Parameter names and values 4 Response names and values 5 CoP matrix
The table template contains the MOPSolver field function for all responses and criteria of the reference design. You can use it like all other Excel functions.

Prepare an Excel worksheet with the following data:
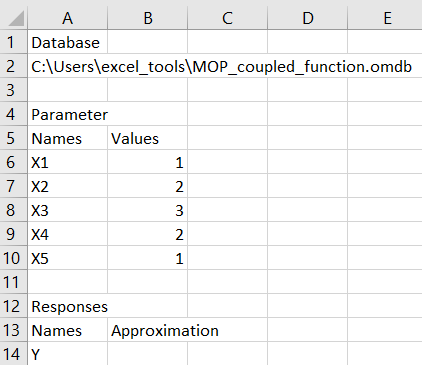
Note: The A2 cell must contain the full path to the working directory where you have place the excel_tools folder.
Click cell B14.
On the Excel Ribbon, switch to the tab.
Click Insert Function.
In the category list, select
Select the MOPSolver function.
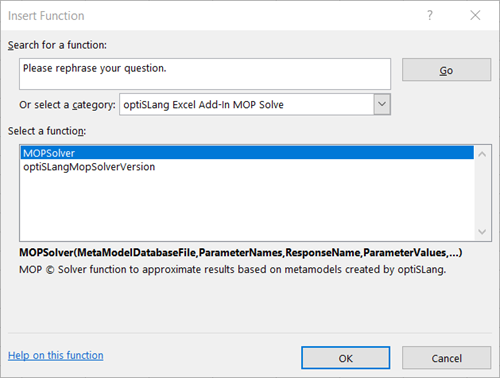
Click .
For the MetaModelDatabaseFile argument, select cell A2.
For the ParameterNames argument, select cells A6, A7, A8, A9, and A10.
For the ResponseName argument, select cell A14.
For the ParameterValues argument, select cells B6, B7, B8, B9, and B10.
For the Extrapolate argument, enter
0.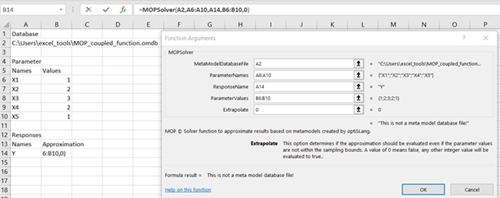
Click .
The approximation value is displayed.
