


The menu provides these options for choosing what is shown in the main oSP3D pane:
Data Table
The data table lists the field quantities, scalar quantities, and individual examples. The data object buttons allow you to hide and display results, field data, and/or scalar data.
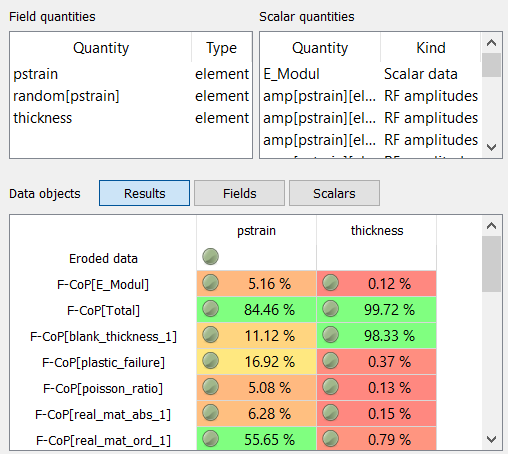
To visualize results and samples, you either double-click them or select one or more and then press the Enter key. You can repeat this to render the same result or sample several times.
Visualization
The 3D visualization is shown in the main pane by default.
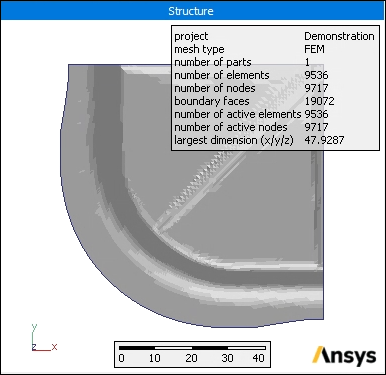
When you render a scene for one or more results and samples, after creating the first scene, oSP3D automatically switches to the 3D visualization. When multiple scenes are rendered, in the gray area beneath the main pane, you can select a stamp for a scene to show this scene in the main pane. The scene created last is shown first.
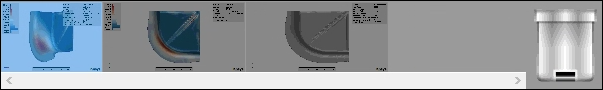
You can place the mouse cursor over a stamp to see information about the scene. The reference structure, which is always shown, cannot be deleted.
To display a different scene in the main pane, drag the stamp for the scene from the gray area and drop it in the main pane. The stamp for the active scene is highlighted in blue.
To activate a scene, click the image. Because visualizing the same result or sample in two different scenes is not supported, you cannot drag an already visualized stamp from the gray area and drop it in the main pane.
To hide an active scene, drag it to the trash icon next to the stamp list.
To remove a scene, drag the stamp to the trash icon.
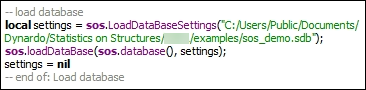
Script Log
The script log shows the actions recorded in your current oSP3D session:
Window Manipulations
The menu provides Tile and Cascade options for displaying the data table, 3D visualization, and script log in individual windows within the main pane. When these windows are cascaded, you might need to rearrange them so that all three are visible.
When only one of these windows is shown, selecting , , or from the menu displays the selected window.
When multiple windows are tiled or cascaded, selecting , , or from the menu makes the selected window active.
To restore oSP3D to the default layout, see the tip here.
Multiple Item Selection
From the data table and the 3D visualization, you can execute menu options for multiple field quantities, scalar parameters, and individual data objects at once.
To select a group of consecutive items, left-click and drag.
To select or deselect a group of consecutive items, press and hold down the Shift key while left-clicking items.
To select non-consecutive items, press and hold down the Ctrl key while left-clicking items.