


Like in optimization, it seems attractive to substitute the solver responses by a surrogate model in order to save computation time for the solver calls in the reliability analysis, or to afford more function evaluations of the surrogate. It should be mentioned that accuracy requirements are higher in reliability analysis as compared to optimization. Early approaches (Faravelli 1989), (Bucher and Bourgund 1990) are based on classical Response Surface Methodology (RSM) using systematic designs of experiments (DoE) and polynomial regression models.
In the current optiSLang implementation, supports are generated by Latin Hypercube Sampling in the first step. The approximation model is of Moving Least Squares type, see Metamodel of Optimal Prognosis. The probability of failure is computed by Directional Sampling, applied on the surrogate model.
Figure 5.6: Parabola Example: Response Surface and Directional Sampling Generated by Adaptive Response Surface Procedure
Directional Sampling yields points on the failure surface of the surrogate model ḡ(x0)=0. It is assumed that these points are already close to the "true" failure surface. Hence in the subsequent steps, these points are updated by passing the input values to the solver and computing the respective responses. The flexibility of the Moving Least Squares model does not require regular DoE schemes as supports and allows for a local improvement in the region of interest, i.e. close to the failure surface.
The accuracy of this method depends largely on the quality of the surrogate model. It is measured as the R 2 predicted value computed by a "leave one out" algorithm. The Adaptive Response Surface method proves to be very efficient and accurate for a wide range of applications, but typically, the efficiency decreases with increasing dimension.
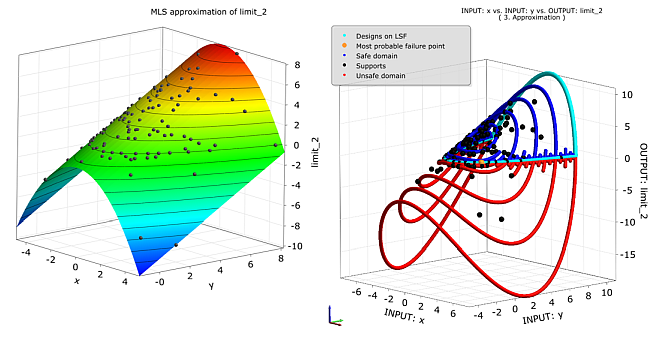
??? shows the moving least squares model and an anthill plot for the parabola example (Adaptive Sampling (ADSAP)). The anthill plot comprises supports of the response surface and samples of the directional sampling procedure. The additional supports can be observed near the "Designs on Limit State Surface".