


The FRF Plotter displays the FRF graphs of all the selected DOF pairs (rows) in the second table in the FRF Worksheet. It is displayed when a completely defined DOF pair is selected in a solved FRF Calculator object.
The FRF Plotter is divided into two parts:
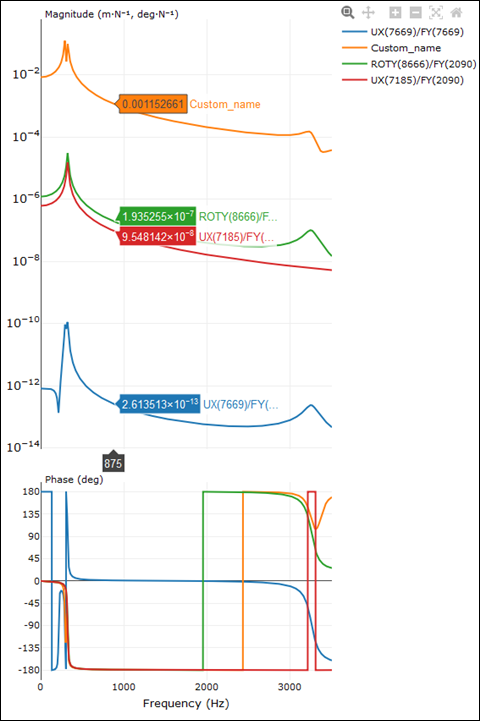
- FRF Plot
A dynamic plot that allows hovering, zooming and panning operations. Depending on the Plot Type, the complex plot can be shown in Magnitude/Phase or in Real/Imaginary graphs. The maximum and minimum frequency values on the x-axis are restricted to those defined in the FRF Calculator Details. The entire data range can be plotted by clicking the option. Clicking the icon (reset axes) replots the data in the user-defined frequency range.
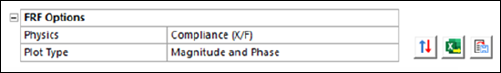
- FRF Options
The following properties are available:
Physics
Allows you to change the Physics of the FRF calculation (, or , according to the FRF Calculation Method). You can click the button to reverse the physics and instead calculate (F/X), (F/V) or (F/A). Reverse Physics will skip 0 values of the direct FRF.
Plot Type
Allows you to toggle between the and displays in the FRF Plot.
An export is triggered by clicking the buttons to the right of the Details view.
The file format for export can either be CSV (Export to CSV file button) or UNV (Export to UNV file button, only if the Physics is not reversed). For CSV files, the FRFs are exported using the same format in which they are plotted (Magnitude/Phase or Real/Imaginary), and with the same Physics. For UNV files, the FRFs are exported in Real/Imaginary format and with Compliance (X/F) Physics.