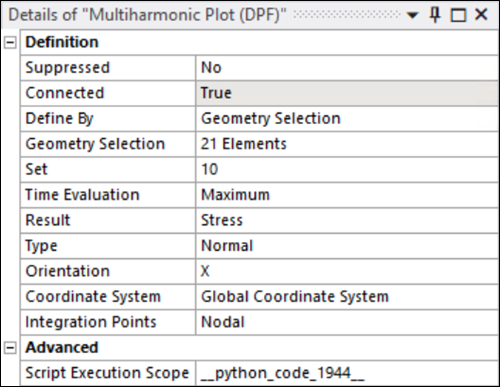
This is a Python result contour plot of the maximum, minimum or amplitude values of a time domain signal as a composition of harmonic responses excited at different frequencies. This is only available as a result under harmonic analysis. For a chosen Set, all harmonic responses are calculated, and total response is displayed for the chosen result type.
- Define By
Allows you to choose between and .
- Selection
Allows all FE ( and ) and Geometry (, , and ) selections. Results cannot be scoped to mid-side nodes for multiharmonic combination objects.
- Set
Drop-down that contains the available sets for evaluation. For example, to evaluate the composite result of the last frequencies of each harmonic step, select the last set available in the list.
- Time Evaluation
Drop-down that contains , and .
- Result
Drop-down contains , and . Elemental results for Elastic Strain are not supported for this Result object.
- Type
This is available when the Result chosen is or . The available types are and components for or .
- Orientation
Depending on whether or components are requested, the drop-down offers different orientation options.
- Coordinate System
Drop-down contains and Solution Coordinate System.
- Integration Point
Drop-down that is available when Result is either or . or result display options are available.