


Inserting this object under the Solution plots a graph containing the synthesized result (the combination of all harmonics) along with the contribution of each order. This facilitates the identification of orders and frequencies contributing the most to the overall response.
- Scoping Method
and for single nodes and elements. Results cannot be scoped to mid-side nodes for multiharmonic combination objects.
- Domain
Drop-down that contains options to set the plot domain to Frequency and Time.
- Result Number of Points
You can choose the number of time domain points used to calculate and display the graph. Requesting more points leads to a more precise evaluation but at the cost of evaluation time. By default, an internal algorithm is used.
- Number of Cycles Increment
You can choose the number of cycles of the combined signal. The number of cycles is the number of periods of the fundamental frequency that are shown in the plot. The default value is
1.- Frequency Set
This option is available only if Chart Type is set to . This is used to choose time domain signal to plot. For example, to evaluate the composite result of the last frequencies of each harmonic step, select the last set available.
- Time Evaluation
Drop-down that contains options to plot , , or values.
- Results
Expanded results that are available, such as and (DOF results and Beam SEQV). Refer to the table below to see what is available for each scoping type.
- Engine Order Input
Shows a table with detected/calculated orders that you can deactivate by deleting rows. Refer to Multiharmonic Combination for more information about engine orders.
- Calculate Individual Orders
Drop-down that contains the option to select or . Setting the option to will show the response of all orders along with the synthesized response. Setting the option to will only show the synthesized response.
- Y Log Scale
This option is available only if Chart Type is set to . Sets the scale to logarithmic if set to .
- X Axis Units
This option is available only if Chart Type is set to . The drop-down contains options to set units in , and .
- Limit Search to Range
Allows you to input the minimum and maximum values of each axis manually.
- Solver Unit System
This read-only field shows the unit system used to display the object.
After providing the inputs, you can right-click the object and select . This will populate the chart and tabular columns, showing the synthesized (composite) value of all harmonic responses. If individual orders are requested, they are plotted as well. The plot contains an option to select and deselect the orders to display.
A tabular data display also shows the plot values.
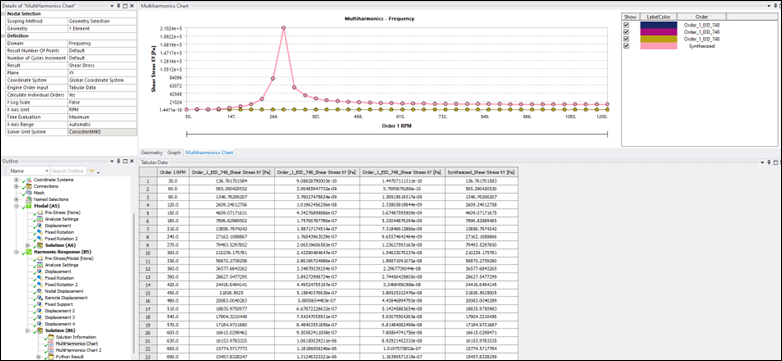
Table 3.1: Allowed results for each selection type
| Solid | Shell | Beams | |||
|---|---|---|---|---|---|
| Node | Element | Node | Element | Node | Element |
| Deformation | Normal Stress | Deformation | Normal Stress | Deformation | Axial Force |
| Velocity | Shear Stress | Velocity | Shear Stress | Velocity | Axial Stress |
| Acceleration | Acceleration | Acceleration | Shear Stress (Torsion) | ||
| Rotation | Rotation | Torque | |||
| Angular Velocity | Angular Velocity | SEQV | |||
| Angular Acceleration | Angular Acceleration | ||||