


The Mechanical application enables you to apply velocities from a structural Harmonic Response analysis or a FSI Harmonic Acoustics analysis as loads in a Harmonic Acoustics analysis. Options are available that enable you to import individual velocity loads or to automatically generate multiple velocity loads from the upstream system.
You can also apply velocities from a Motion analysis as loads in a Harmonic Acoustics or Coupled Field Harmonic analysis. Options are available that enable you to convert time-dependent velocities to frequency-dependent velocities and then to import individual velocity loads or to generate multiple velocity loads automatically from the upstream system.
The load transfer is applicable for the cases where the Harmonic Response or FSI Harmonic Acoustics and acoustic analyses are solved using different meshes. When different meshes are used, the velocity values are mapped and interpolated between the source and target meshes.
Note:
If the upstream (Structural or FSI Acoustics) system is modified and re-solved after importing the load, a refresh operation on the acoustic system’s Setup cell is required to notify Mechanical that source data has changed and re-import is required. Alternatively, the source data can be refreshed using the right-click operation on the Imported Load folder and choosing the Refresh Imported Load option.
If an upstream Harmonic Acoustics system is used, it must contain Structural Physics Region(s).
If the upstream system contains Condensed Parts, the velocities of these parts are ignored during data transfer.
Workflow
- Specify Analysis Systems in Workbench
Review the following steps to create and define your upstream system and property configure your downstream acoustics analysis.
From the toolbox, drag and drop a Harmonic Response or Harmonic Acoustics template onto the Project Schematic. Open the model in Mechanical and perform all steps to set up a Harmonic Response or Harmonic Acoustics analysis. Specify mesh controls, boundary conditions, and solution settings as you normally would and solve the analysis.
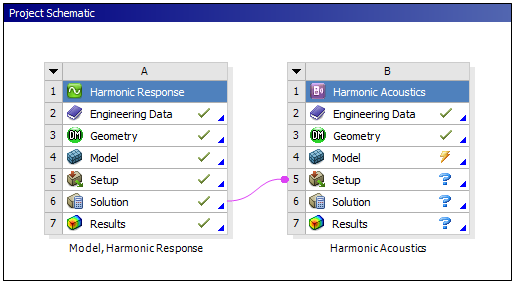
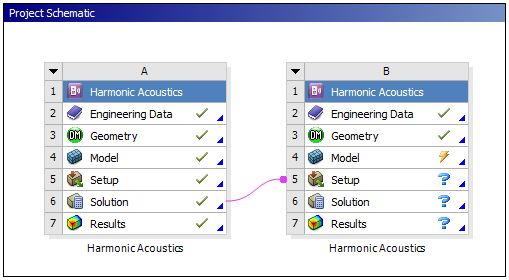
Return to the Project Schematic and drag and drop a Harmonic Acoustics template onto the Project Schematic. Drag the Solution cell of the structural or FSI acoustics system onto the Setup cell of the acoustic system. Examples are illustrated below.
Open the downstream system in Mechanical.
- Import Velocities
You may perform prerequisite property definitions as needed, such as making necessary entries for the Analysis Setting and the Acoustics Region.
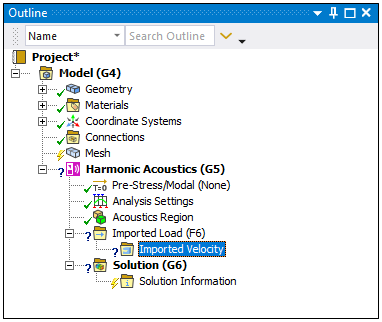
Select the Imported Load folder/object, and:
Open the folder. By default, the application inserts a Imported Velocity object. As needed, you can add Imported Velocity objects by right-clicking on the Imported Load folder and selecting > .
Or...
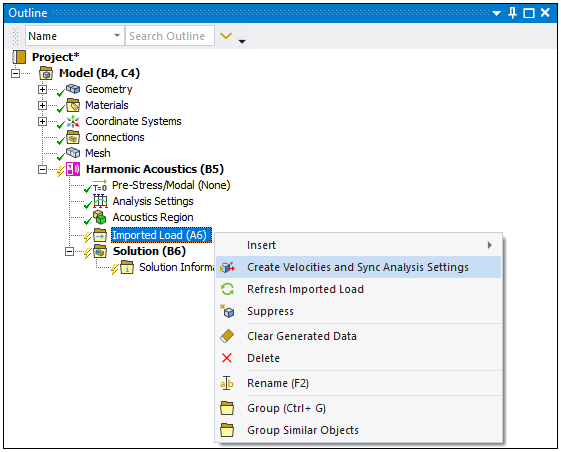
Right-click the folder and select the option to import all of the velocity loads available in the upstream system.
Select appropriate geometry in the Details view of the imported velocity object(s) using the Geometry or Named Selection scoping option.
The Source Bodies property in the Details view enables you to select the bodies, from the upstream analysis, that makeup the source mesh for mapping the data. The options for this property include:
: The source mesh in this case will comprise all the bodies that were used in the upstream analysis.
: This option enables you to select one or more source bodies to make up the source mesh. The source body selections are made in the Material IDs field by entering the material IDs that correspond to the source bodies that you would like to use. Type material IDs and/or material ID ranges separated by commas to specify your selection. For example, type 1, 2, 5–10. The material IDs for the source bodies can be seen in Solution Information object of the source analysis. In the example below, text is taken from a solver output,
***********Elements for Body 1 "coil" ***********
***********Elements for Body 2 "core" ***********
***********Elements for Body 3 "bar" ************
Body "coil" has material ID 1, body "core" has material ID 2 and body "bar" has material ID 3.
: When you set the property to Named Selection, the Source Component property also displays. This property provides a drop-down menu that enables you to select a Named Selection defined in the upstream system. This option can improve performance by reducing the number of transferred source nodes.
If your upstream system includes multiple RPMs, The RPM Selection property enables you to select the RPM for which the data is imported.
Change any of the columns in the Data View pane as needed:
Source Frequency: Frequency at which the velocities will be imported from the structural analysis.
Analysis Frequency: Choose the analysis frequency at which the load will be applied.
Note: The Data View can automatically be populated with the source and analysis frequencies using the Source Frequency property in the Details pane. Use to import data at all frequencies in the source analysis, or to import data for a range specified by a Minimum and Maximum. The default Worksheet option requires users to manually input the Source Frequency and Analysis Frequency.
You can transform the source mesh used in the mapping process by using the Rigid Transformation properties. This option is useful if the source geometry was defined with respect to a coordinate system that is not aligned with the target geometry system.
You can modify the Mapper Settings to achieve the desired mapping accuracy. Mapping can be validated by using Mapping Validation objects.
Right-click the Imported Velocity object or on the Imported Load folder and click to import the load(s). Following successful import, vectors plot (), or contour plot (///) of the real/imaginary components of velocities can be displayed in the Geometry window using the Component property in the details of imported load.
Note: The range of data displayed in the graphics window can be controlled using the Legend controls options. See Imported Boundary Conditions for additional information.
If multiple rows are defined in the Data View, it is possible to preview imported load vectors/contour applied to a given row or analysis frequency in the Data view. Choose Active Row or Analysis Frequency using the By property under Graphics Controls in the details of the imported load and then specify the Active Row/Analysis Frequency to preview the data.
Note: If you specify the Analysis Frequency that does not match the list of analysis frequencies in the Data View, the data is displayed at the analysis frequency closest to the specified frequency.