VM-LSDYNA-SOLVE-014
VM-LSDYNA-SOLVE-014
2D Axisymmetric Thermal Expansion
Overview
| Reference: | Kreith, F. (1959). Principles of Heat Transfer (2nd ed.). International Textbook Co. |
| Analysis Type(s): | Thermal Expansion |
| Element Type(s): | Solid, *MAT_ELASTIC_VISCOPLASTIC_THERMAL+ |
| Input Files: | Link to Input Files Download Page |
Test Case
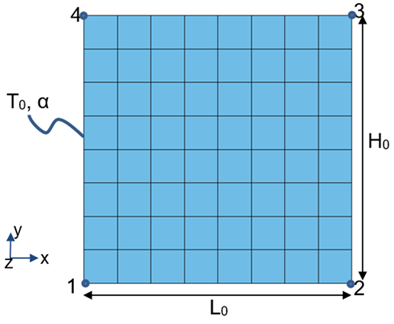
A hollow steel cylinder with thickness 2.0 m and height 2.0 m has a constant thermal generation rate of 100000°C/s. The cylinder has initial temperature T0 = 0°C and coefficient of thermal expansion α = 2x10⁻⁶°C-1. Find the height and thickness of the cylinder at t = 1 s.
| Material Properties | Geometric Properties | Loading |
|---|---|---|
| k = 1W/(mo °C) | L0 = H0 = 0.110625 m | α = 2E-6°C-1 |
| h = 1 W/(m2 °C) | – | T0 = 0°C |
| – | – | g = 100000°C/s |
Analysis Assumptions and Modeling Notes
LS-DYNA Thermal Solver 1 is input to use the old ACTOL solver. The cross-sectional area of the cylinder is modeled using shell elements with ELFORM 15. Steel material properties and coefficient of thermal expansion is defined in *MAT_ELASTIC_VISCOPLASTIC_THERMAL. Constant thermal generation rate is defined using TGMULT in *MAT_THERMAL_ISOTROPIC.
Translational geometric boundary constraints are set using *BOUNDARY_SPC_SET: In the y and z directions, constraints are set on the bottom edge (1-2). In the x and z direction, they are set on the inside edge (1-4). Node 1 in the above sketch is constrained in all DOFs. Node 2 is allowed to move only in the x direction, node 3 in the x and y directions, and node 4 in the y direction.
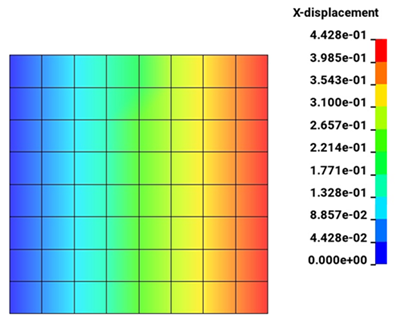
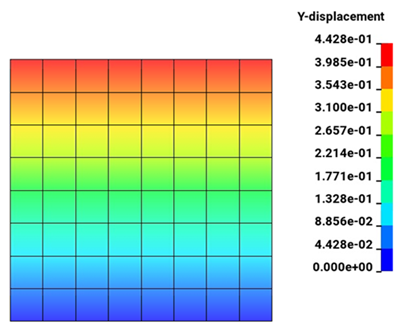
Symmetry is exploited so only a slice of the hollow cylinder is present. The temperature at t = 1 s:

The thermal expansion coefficient can be expressed as:

Then we get:

LHS is integrated from T0 = 0°C to Tf = 100000°C. And RHS is integrated from L0 = 2.0m to Lf gives the analytical solution Lf = 2.4428 m