Mesh quality is displayed as a histogram where the abscissa (x-axis) displays the element quality on a scale from 0 (worst) to 1 (best) and the ordinate (y-axis) displays the number of elements in each quality range. The default is 20 bars or divisions between 0 and 1. So the first bar would display the number of elements whose quality is between 0 and 0.05, and the next bar between 0.05 and 0.1. The same histogram values are also tabulated in Messages window. The Status message line will display the min and max values of the quality criterion.
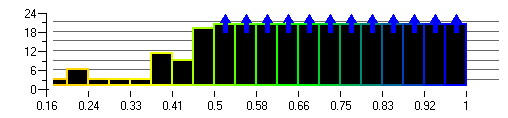
By clicking any of the bars with the left mouse button, the information about the precise number of values that fall into this interval and its boundaries are displayed in the message window. The color contour bar will also appear in the display. Histogram bars that have been selected become a solid color, and remain selected until clicked again. To display the elements within a selected (highlighted) histogram bar, right-click the histogram window, and click Show (enabled by default). The elements represented by that bar will be highlighted. If the Solid option is enabled, then the color of the elements will represent the corresponding range of quality as indicated by the color contour bar.
By right-clicking the histogram, the following options are available.
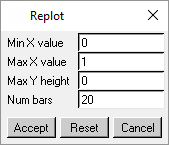
- Replot
allows you to change the parameters of the histogram in the Replot window.
Min / Max X value
sets the minimum and maximum values of the particular quality type selected for the X-axis.
Max Y height
sets the maximum number of blocks for the quality ranges. A value of 0 will set the display to such that the histogram with the largest number of elements is fully visible. A smaller number will give increased resolution for quality ranges with fewer elements.
Num bars
sets the number of bars to use in the histogram display.
- Reset
sets the maximum number on the Y-axis such that the histogram bar with the largest number of elements is fully visible.
- Refresh
recomputes the mesh quality and refreshes the histogram display.
- Show
displays the elements within the selected (highlighted) histogram bars.
- Solid
displays all selected elements in solid view and by color that corresponds to the quality range. The color contour bar will display the range of quality by color.
Note: This option slows down the display speed.
- Color By Quality
when enabled (default), clicking on any histogram bar will display those elements colored according to quality, as defined by the color bar which appear on the left side of the display window.
- Highlight
applies to surface mesh only. Select one of the following options to highlight: selected elements only, selected elements and one layer of attached surface elements, or selected elements and two layers of attached surface elements.
- Subset
puts the selected elements into a new subset.
- Done
closes the histogram window.