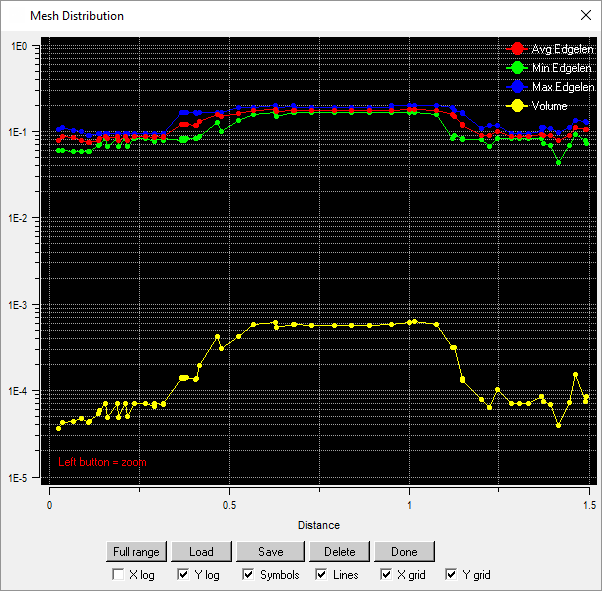
The mesh distribution for all elements intersected by the line defined by the Start Point and End Point locations will be calculated and displayed in the Mesh Distribution window. Distribution indicates the criterion selected. You can display the distribution for element volume (Volume), average element edge length (Avg Edgelen), minimum element edge length (Min Edgelen), or maximum element edge length (Max Edgelen). The distribution is displayed as a graph where the abscissa (x-axis) indicates the distance of the element centroid (projected onto the line) from the Start Point and the ordinate (y-axis) indicates the selected criterion (Volume, Avg Edgelen, Min Edgelen, or Max Edgelen). This diagnostic is available for linear, tetra, pyramid, penta, and hexa elements.
Figure 421: Mesh Distribution shows an example of the mesh distribution displayed. You can use the left mouse button to zoom a portion of the plotted distribution.
- Full range
resets the plot in the Mesh Distribution window to show the full range.
- Load
allows you to load the mesh distribution data from a file.
- Save
allows you to save the mesh distribution data to a file.
- Delete
allows you to select the plots to be removed from the Mesh Distribution window.
- Done
closes the Mesh Distribution window.
- X log
toggles the logarithmic scaling of the x-axis.
- Y log
toggles the logarithmic scaling of the y-axis.
- Symbols
allows the use of symbols to mark data.
- Lines
allows the use of a line to indicate the distribution data.
- X grid
toggles the display of grid lines along the x-axis.
- Y grid
toggles the display of grid lines along the y-axis.


