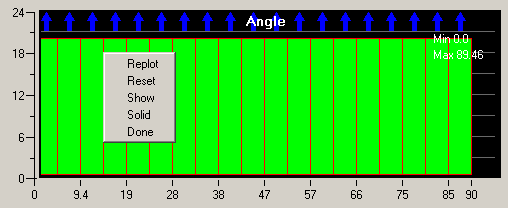
After computing the determinant values of the elements, a histogram of the values will be displayed. The X-axis represents the quality range for the particular type, and the Y-axis represents the number of elements within a particular histogram bar. An arrow at the top of a histogram bar indicates that there are more elements in that bar than are displayed per the current maximum number on the Y-axis.
By clicking any of the bars with the left mouse button, the information about the precise number of values that fall into this interval and its boundaries are displayed in the Messages window. Bars that are clicked change color, and remain selected until clicked again. To display the elements within a selected (highlighted) histogram bar, right-click the histogram window, and select Show.
The histogram of the Angle Quality for a certain hexahedral block is shown in Figure 406: Histogram of Angle Quality. The histogram options menu is also shown.
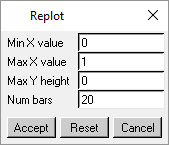
The histogram options are as follows:
- Replot
allows you to change the parameters of the histogram using the Replot window.
- Min / Max X value
sets the minimum and maximum values of the particular quality type selected for the X-axis.
- Max Y height
sets the maximum number of blocks for the quality ranges. A value of 0 will set the display to such that the histogram with the largest number of elements is fully visible. A smaller number will give increased resolution for quality ranges with fewer elements.
- Num bars
sets the number of bars to use in the histogram display.
- Reset
sets the maximum number on the Y-axis such that the histogram bar with the largest number of elements is fully visible.
- Show
displays the elements within the selected (highlighted) histogram bars.
- Solid
redraws all selected elements using flat shading, according to the color map.
- Done
closes the histogram window.


