


In addition to the PREPARED and SELECTED files that indicate that the job scripts are in a Run directory with a prepared set of simulation files that are ready to be run, there are several other run-control files that are used by the batch scripts. Most of these files are empty (zero-length) files that serve as controls purely by their presence or absence. A complete list of these files is in Table 5.3: Run-control file names and purposes .
Table 5.3: Run-control file names and purposes
|
File name |
Purpose |
|---|---|
|
PREPARED |
Simulation files are prepared and ready to run. |
|
SELECTED |
Run is selected (check box was checked) to be run. |
|
RUNNING |
Run is currently processing. |
|
ERROR |
Run has finished, but with an error condition. The ERROR file contains an error message or exit status code. Check the FORTE.log and the MONITOR file for specific error messages. |
|
COMPLETE |
Run has finished successfully. |
|
SAVE_RESTART |
Create a restart file after the current time step has been processed. |
|
SAVE_SOLUTION |
Create a CGNS solution file after the current time step has been processed. |
|
SAVE_SOLUTION_ALL |
Create a DVS solution output after the current time step has been processed. |
|
STOP |
User has signaled for the Run to stop (if running) or not be run if not yet running. |
|
STOPPED |
User performed the STOP command; Run has stopped. |
|
MONITOR |
Contains the program output ("stdout") and program error output ("stderr") from the run and the sourcing of the environment setup file prior to the run. This is the file whose contents is displayed in the Monitor tab pane. The content of this file is similar to the FORTE.log file, but not identical. |
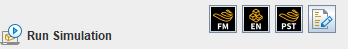
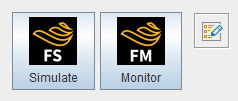
While the simulation jobs are running, they are writing results into the solution file (.ftind and .ftres) and also writing to several .csv files that can be used for plotting intermediate results. You can display partial results, such as a pressure trace, using the Monitor panel, launched by pressing the Monitor Runs icon, on the left end of the Run Simulation panel in Figure 5.5: Run Simulation panel 's icon bar with Monitor Results icon , and on the Launcher dialog illustrated in Figure 5.6: Launcher dialog with Monitor Results icon .
For jobs that are running, several comma-separated value (CSV) files are being updated with results that can be plotted. The job's output is also displayed in the tab shown below the plot area. One tab is shown for each running or completed job in the Analysis directory. When the Monitor is run from the Launcher, select the location of the .ftsim project file that has generated some output to monitor.
Plots can be generated by expanding the twistie for one or more of the
.csv files shown as folders on the left panel and clicking on
the check-box for any plot desired. The plots can be resized or repositioned. To
remove a plot, clear the same check box that triggered it to be displayed. If you
have several plots, you can reformat the overall display to put them in either
horizontal tiles or a stacked display using the two buttons that control views  .
.
To modify which runs in a parameter study are plotted, click the Select
Runs to Plot ![]() icon. By default, the plots in the monitor window are
automatically updated every 5-10 seconds. This updating may be turned ON or OFF by
selecting the
icon. By default, the plots in the monitor window are
automatically updated every 5-10 seconds. This updating may be turned ON or OFF by
selecting the  or
or  icons. By default, the X axis of each plot is set to be the
first variable listed in the CSV data. To use a different value for the X axis,
right-click the desired variable in the tree and select the Set x
Axis option.
icons. By default, the X axis of each plot is set to be the
first variable listed in the CSV data. To use a different value for the X axis,
right-click the desired variable in the tree and select the Set x
Axis option.