This section provides step-by-step how-to instructions on the following topics:
Here are a few things that may help improve the post-processing experience:
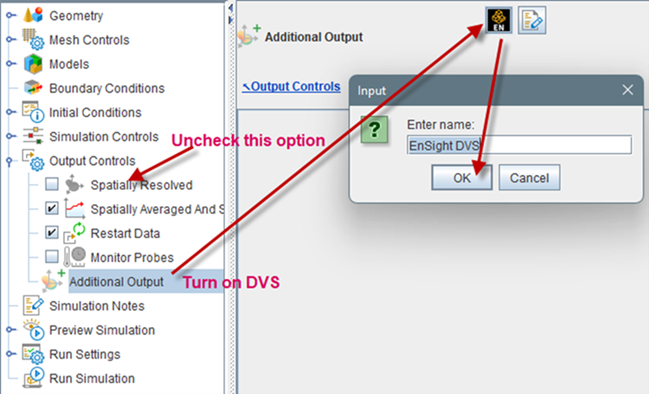
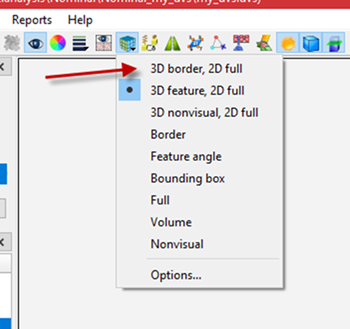
If you are using the .ftres file format, you can try switching to the new "EnSight DVS" file format. Benchmark shows that the DVS format not only results in smaller output file size, but also reduces the loading time in EnSight by more than 50% on average. Referring to Figure 9.1: Adding the DVS format using the Additional Output option, you can turn off the default .ftres format by unchecking the Spatially Resolved box and turn on the DVS format by adding a new Additional Output. The DVS output control panel has a similar layout as its .ftres counterpart. The DVS solutions will be saved in a subfolder within the Nominal folder. The .dvs file is the one to be opened in EnSight. After loading the DVS solutions in EnSight, the VolumeCells is displayed as "3D feature, 2D full" (wireframe) by default. If you prefer, you can change it to "3D border, 2D full" to get a display similar to the .ftres option, as seen in Figure 9.2: Display options in EnSight.
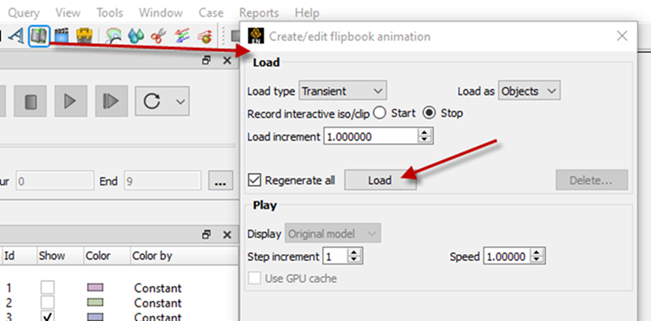
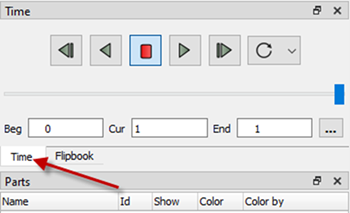
After the solutions have been loaded in EnSight, switching from one solution to another may take some time. If you have a detailed plan about which cutplane to make, which variables to plot, etc., you can create all these "parts" and then create a flipbook to load the solution at all time locations (see Figure 9.3: Creating and loading a flipbook in EnSight). Loading the flipbook might take some time, but after it has been loaded, switching between solutions will become instant. If you need to plot multiple variables on the same cutplane, you can clone the cutplane so that each cutplane carries one variable. Make sure the "parts" are checked on before loading the flipbook. Unchecked parts will not be included in the flipbook. If you need to change the variables being plotted or change the location of the cutplane etc. after the flipbook has been created, you'll need to go back to the "Time" option (see Figure 9.4: Time option in EnSight) to do the editing and then reload the flipbook.
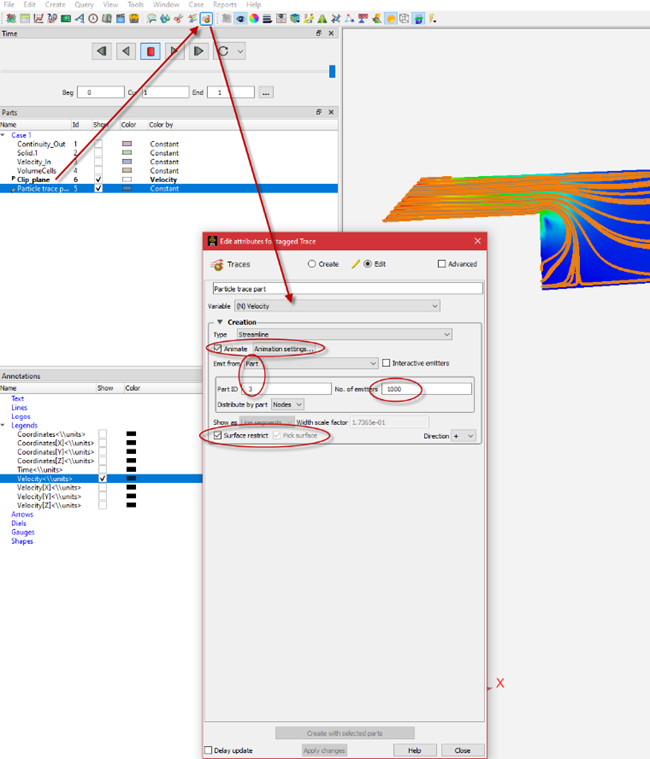
Create a clip plane on which you want to create the streamline.
Click the Particle Tracing icon in the ribbon bar.
Select Velocity as the variable.
Select Emit from Part and specify the Part ID. In this example, Velocity_In is selected as the emitter. A larger number of emitters will create more streamlines.
Check Surface restrict and Pick surface. Then on the parts list, select the clip plane just created.
Click Create with selected parts.
Change the values within Animate Settings to adjust how often the streamline should be refreshed.
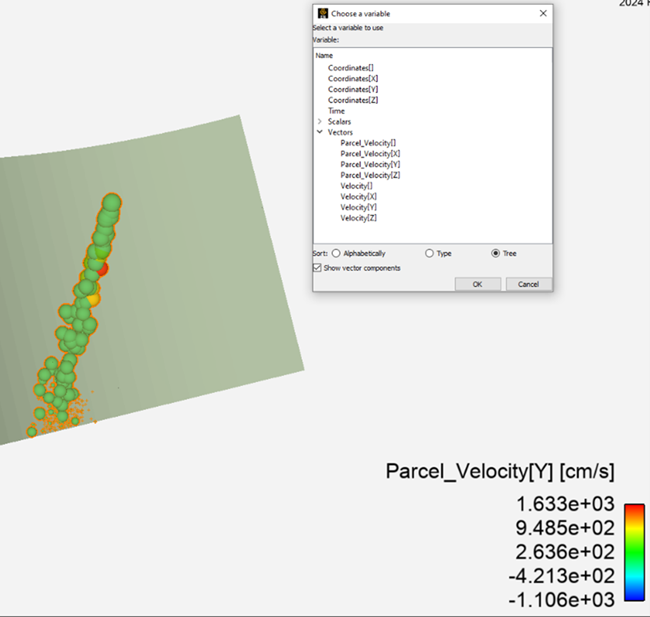
If you use the right-click context menu to select a variable to "color by" for spray parcels within the dialog, there is an option to "Show vector components". When you do, you should be able to select the components.
Load in the Forte solutions in either .ftind/.ftres format or DVS format into EnSight.
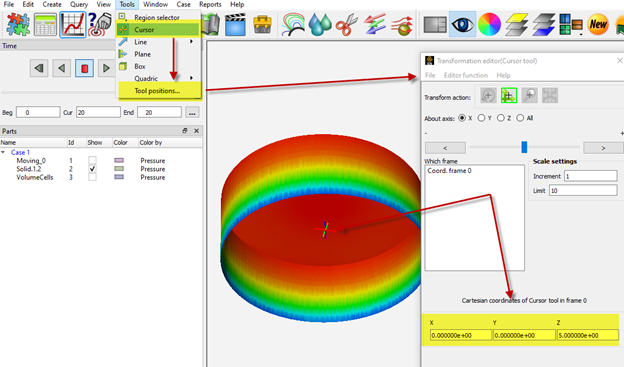
Pick the location for the monitor probe point. The location can be specified using the Cursor (Point) tool. Click Tools > Cursor to activate the cursor tool. Click Tool positions... to edit the XYZ coordinates of this point. The location of the cursor can be seen in the graphic region. For more information about the Cursor tool, refer to Use the Cursor (Point) Tool in the Ansys EnSight How-To Manual.
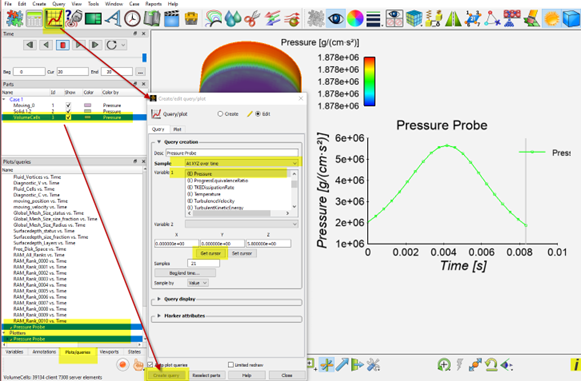
Use the Query/Plot tool to create the monitor probe at the cursor location. Click the Query/Plot tool icon on the menu bar. Under the Query tab, open the Sample drop-down list, and select At XYZ over time. For Variable 1, select Pressure or any variable of interest. Leave Variable 2 empty. Click Get Cursor to use the current cursor location set in the previous step. Select VolumeCells on the parts tree, click Create query. The query and its plot will occur on the Plots/queries tab at the lower left corner of the window. The plot (Pressure Probe in this example) will also be shown in the graphic window.
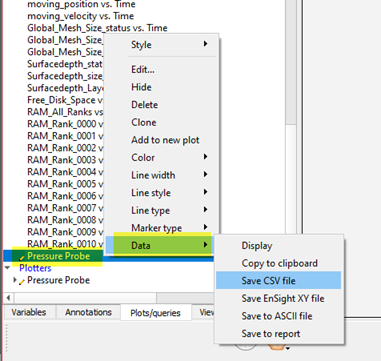
If needed, you can export the query data to clipboard or to a file. Right-click this query item, select Data and then choose where to save the data.