This section provides step-by-step how-to instructions on the following topics:
By default, Forte Monitor always runs in a mode to automatically refresh the display of data. This is helpful when monitoring an on-going simulation. However, this is not helpful when trying to zoom into a part of the plot or customize ranges. What you might want to do in this case is to click the Stop Monitoring Runs button:
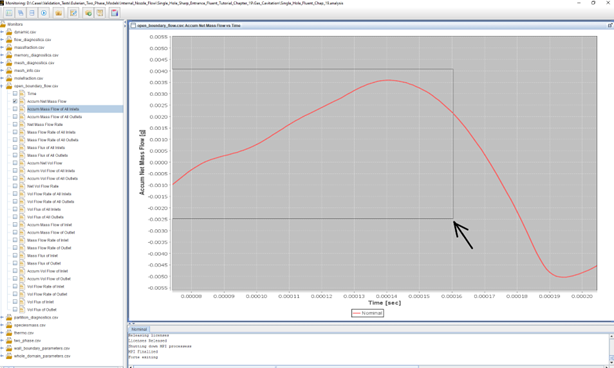
Then, as you zoom in or customize ranges on a plot, it won't refresh and override your changes. To "zoom in", you can use your cursor to draw a rectangle on the plot which encloses the x- and y- ranges that you want. After drawing the rectangle, the plot will zoom to the x- and y- ranges enclosed in the rectangle.
If you have stopped monitoring runs, the plot will not refresh and will stay within the zoomed-in ranges.
Note: When "monitoring runs" is stopped, the plots will not be updated when different runs are selected to display. When you want to select a different run to display, you need to click the Resume Monitoring Runs button to make it effective. When resumed, all the plots are changed back to their default ranges.


