


In certain cases, you are able to better visualize your flow field variables in the workspace by means of rendering the flow field quantity as a volumetric space. This can be an aid in visualizing the effects of the volume on a particular flow variable.
To create a volumetric rendering, right-click Volume Rendering in the Outline View tree (or the Ribbon) and select New....
![]() Results → Graphics
→ Volume
Rendering
Results → Graphics
→ Volume
Rendering![]() New...
New...
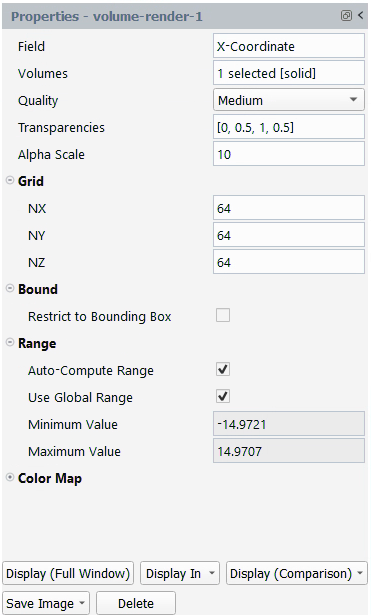
Once you have made your property settings, click to visualize the object in the graphics window. You can also click to save an image file of the object in the graphics window. Click Delete to remove the object.
Allows you to create a new volume rendering object.
- Field
Select the field variable that you want to use for creating the volume render.
- Volumes
Select the volume(s) where you want to display the volume render.
- Quality
Select the quality of the volume render.
- Transparencies
Specify the transparencies to be used for different field values.
- Alpha Scale
Specify to increase or decrease the transparency with lower values increasing transparency.
Grid
- NX
Specify the number of clusters in the x-direction.
- NY
Specify the number of clusters in the y-direction.
- NZ
Specify the number of clusters in the z-direction.
Bound
- Restrict to bounding box
Enable to specify bounding box extents.
- XMin
Specify the bounding box extents (X Min).
- YMin
Specify the bounding box extents (Y Min)
- ZMin
Specify the bounding box extents (Z Min)
- XMax
Specify the bounding box extents (X Max)
- YMax
Specify the bounding box extents (Y Max)
- ZMax
Specify the bounding box extents (Z Max)
Range
- Auto-Compute Range
Select to automatically determine the range of volume render values.
- Use Global Range
Select to have the volume render display use data from the entire domain.
Color Map
- Visible
Select to have the color key displayed along the volume render display.
- Size
Specify the number of distinct color intervals in the color scale or keep the default value. Values from 2 to 100 are acceptable, where increments of 10 are recommended.
- Color Map
Select a particular volume render color map scheme, or keep the default selection.
- Use Log Scale
Select to have the volume render display use a logarithmic scale.
- Position
Choose the position of the volume render color map in the graphics window, or use the default value.
- Type
Choose the volume render color map presentation of data as general, exponential, or float.
- Precision
Specify the numerical precision for the volume render color map data.
- Show All
Select the skip a certain number of labels (or show all) in the volume render color map.