


In the Madabhushi framework [407], the effects of primary breakup are simulated by the Wave model, and the effects of secondary breakup are simulated by a model suggested by Pilch and Erdman [517]. Figure 12.24: Madabhushi Breakup Model shows particle breakup mechanisms considered in the Madabhushi breakup model.
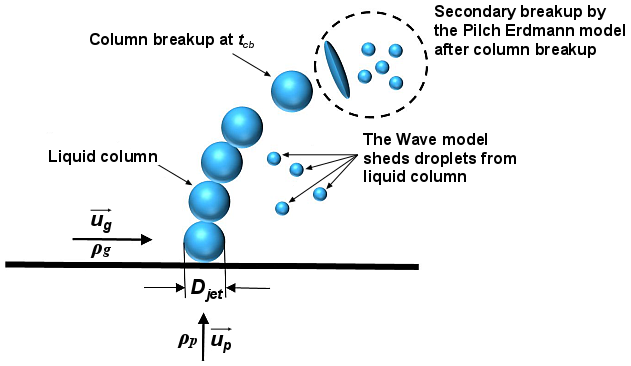
The droplets are injected through an orifice with an exit diameter  . In the primary breakup stage, the jet is represented by a liquid column of
spherical droplets of equal diameters
. In the primary breakup stage, the jet is represented by a liquid column of
spherical droplets of equal diameters  . The initial droplet velocity
  is calculated from the inlet jet velocity and liquid density (or the flow
rate). During this phase, child droplets are shed according to the standard WAVE breakup model.
Subsequent breakups (secondary breakup due to turbulence, capillary and aerodynamic forces) for
such child droplets are modeled using the Pilch and Erdman model [517].
is calculated from the inlet jet velocity and liquid density (or the flow
rate). During this phase, child droplets are shed according to the standard WAVE breakup model.
Subsequent breakups (secondary breakup due to turbulence, capillary and aerodynamic forces) for
such child droplets are modeled using the Pilch and Erdman model [517].
The droplet stays in the liquid column until the so-called column breakup time
 is reached:
 | (12–447) |
where  is the gas velocity of the crossflow,
  the liquid density, and
  the gas density.
  is the column breakup time constant. Its value varies in different
publications. Ansys Fluent uses the value proposed in the work of Madabhushi [407]
is the column breakup time constant. Its value varies in different
publications. Ansys Fluent uses the value proposed in the work of Madabhushi [407]
 = 3.44. During this phase, the drag remains constant
  = 1.48.
Once the droplet lifetime exceeds the column breakup time  , it undergoes secondary breakup according to Pilch and Erdman’s model
[517]. In this model, the droplet is deformed from a sphere to a disk within
a deformation period
, it undergoes secondary breakup according to Pilch and Erdman’s model
[517]. In this model, the droplet is deformed from a sphere to a disk within
a deformation period  :
:
 | (12–448) |
where  is the characteristic time scale for breakup given by:
 | (12–449) |
Here,  is the relative velocity between droplet and gas, and
  is the local droplet diameter at the column breakup time .
During the deformation period, the droplet’s drag changes according to the following expression:
 | (12–450) |
where the drag coefficient of the disc  =1.2.
=1.2.
The reference area for drag changes according to the following expression:
 | (12–451) |
The drag force acting on the droplet changes as:
 | (12–452) |
where  is the drag coefficient and
  is the cross section area calculated by:
 | (12–453) |
Once the deformation time  is reached, the droplet remains deformed and the drag stays constant:
 | (12–454) |
until the droplet breaks up into five smaller child droplet parcels.
The total breakup time  is dependent on the local Weber number and is determined by the following
correlations:
is dependent on the local Weber number and is determined by the following
correlations:
 | (12–455) |
Due to the rim expansion, the velocity of each child droplet  is calculated as:
 | (12–456) |
where  is the parent droplet velocity, and
  is a normal velocity in a plane normal to the parent droplet velocity
 (see Figure 12.25: Child Droplet Velocity); its magnitude is expressed as:
 | (12–457) |
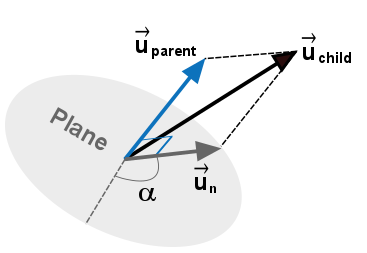
For each of the five droplets, the normal velocity direction angle  is randomly chosen in the range [0, 2π].
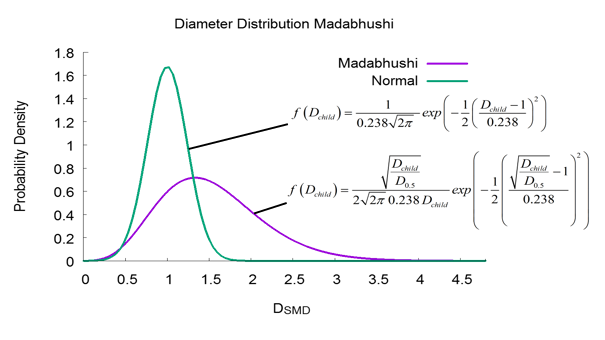
The target volumetric distribution of child droplets after breakup is given by the following root-normal distribution:
 | (12–458) |
where  and denotes the mass median diameter related to the target Sauter Mean Diameter
after breakup as:
and denotes the mass median diameter related to the target Sauter Mean Diameter
after breakup as:
 | (12–459) |
where  is the Ohnesorge number given by:
 | (12–460) |
Here,  is the droplet viscosity,
  is the droplet surface tension, and
  is the reference area of the deformed droplet given by:
 | (12–461) |
where  is the corrected Weber number for high droplet viscosity (
 > 0,1); it is calculated as:
 | (12–462) |
The Madabhushi diameter distribution of the child droplets after breakup compared with the standard normal distribution is shown in Figure 12.26: Madabhushi Diameter Distribution.
The droplets that undergo secondary breakup after column breakup represent real-world
ligaments breaking up from the liquid core. The ligaments vary in shape and eventually break into
smaller ligaments that are not equal in size to the original child droplets produced by the Pilch
and Erdman model, which assumes almost spherical parent droplets. The Pilch and Erdman breakup
model have the tendency to overestimate the child droplet diameters in this region. To overcome
this inaccuracy, the diameters of the child droplets that undergo further secondary breakup after
column breakup are weighted by a factor  >0 to consider the influence of ligaments:
 | (12–463) |
 follows the same target volumetric distribution of child droplets after breakup
shown in Equation 12–458.
follows the same target volumetric distribution of child droplets after breakup
shown in Equation 12–458.
In this mechanism, the child droplets continue to break up further according to Pilch and
Erdman’s model with no child droplet diameter weighting (that is,  =1) until they become so small that the surface tension of the water begins to
form new droplets and no further breakup occurs.
=1) until they become so small that the surface tension of the water begins to
form new droplets and no further breakup occurs.
The same mechanism (that is  =1) is applied to further secondary breakup of droplets shed from the liquid
core by the WAVE breakup model.
=1) is applied to further secondary breakup of droplets shed from the liquid
core by the WAVE breakup model.