VMFL018
VMFL018
Shock Reflection in Supersonic Flow
Overview
| Reference | H.B. Hopkins, W. Konopka, J. Leng, “Validation of scramjet exhaust simulation technique at Mach 6”, NASA Contractor Report 3003, 1979. | ||
| Solver | Ansys Fluent, Ansys CFX | ||
| Physics/Models | Reflecting shocks in supersonic flow; Compressible turbulent flow | ||
| Input File |
| ||
| Project Files | Link to Project Files Download Page |
Test Case
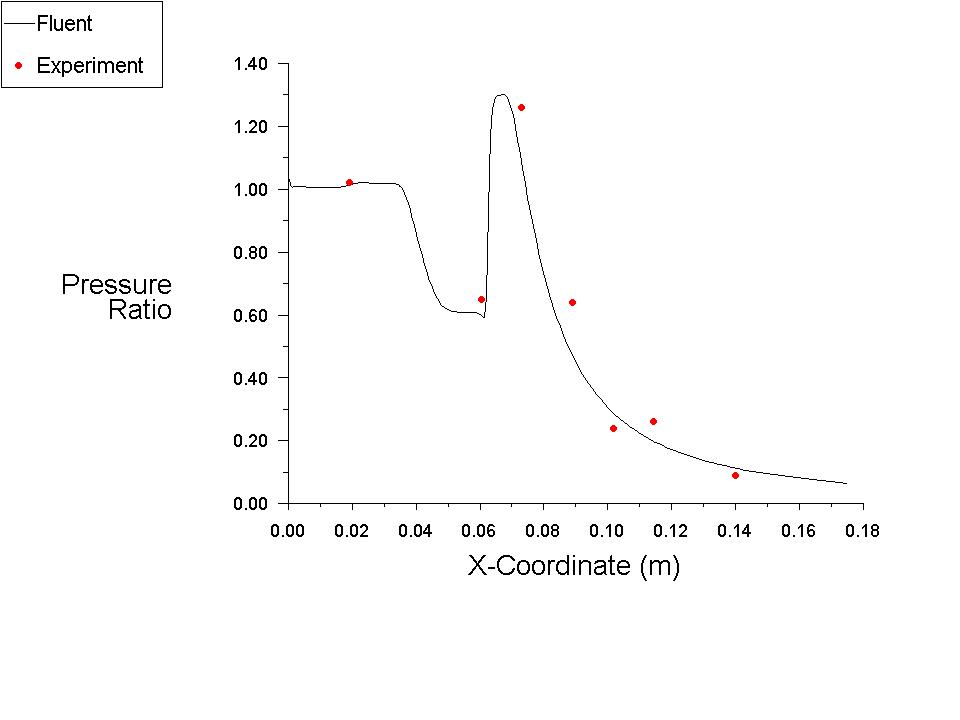
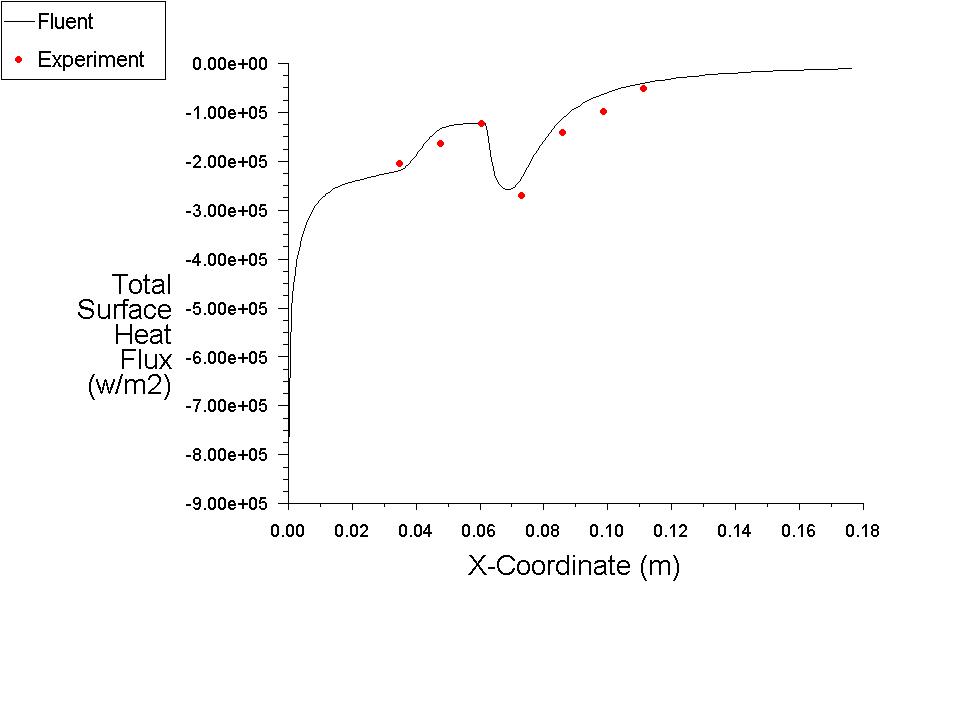
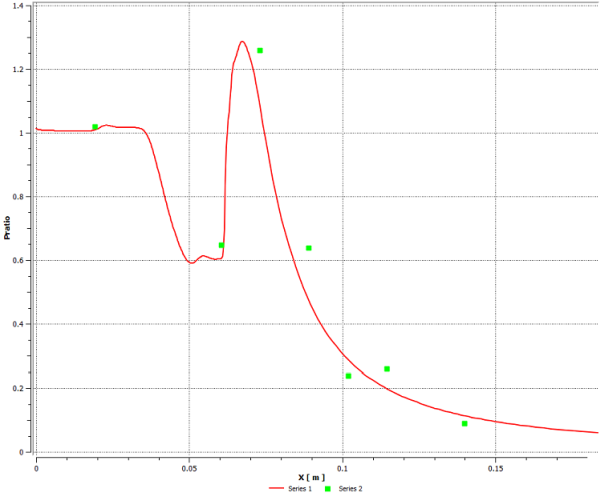
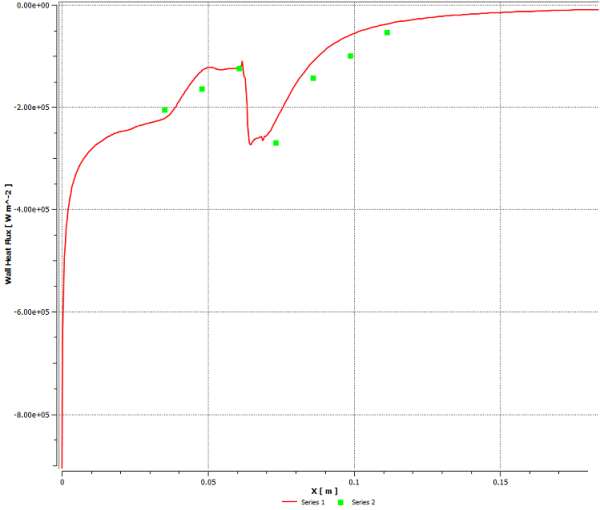
Supersonic flow from a nozzle that represents the exhaust nozzle of a supersonic combustion ramjet (SCRAMJET) is modeled. Jet from the nozzle is issued into a domain which is bounded on one side by an afterbody wall which is parallel to the centerline of the nozzle. Shocks propagating from the nozzle exit reflect from the afterbody. Measured values of (i) the distribution of wall pressure and (ii) heat transfer rate along the afterbody are used to validate the CFD simulation.

| Material Properties | Geometry | Boundary Conditions |
|---|---|---|
|
Density: Ideal Gas Molecular Weight: 113.2 Viscosity: 1.7894 X 10⁻⁵ kg/m-s Thermal Conductivity: 0.0242 w/m-K Specific Heat: Temperature Dependent |
D = 1.524 cm Length of cowl = 3.5 D |
Inlet Total Pressure (gauge) = 551600 Pa Inlet Static Pressure (gauge) = 127100 Pa Inlet Total Temperature = 477.8 K Inlet Turbulent Intensity = 2 % Wall temperature = 328 K Outlet Pressure (gauge) = 2780 Pa |
Analysis Assumptions and Modeling Notes
The flow is steady. Specific heat is defined as a linear function of temperature. Density based solver is used. Under the given pressure conditions, the inlet Mach number is about 1.66.