


You can visualize information about a model by representing variable values with colors, often called fringes. Fringes are an extremely effective way to visualize variable variations and levels. A variable color palette associates (or maps) variable values to colors. Palettes are also used in the creation of contours. The number of contour levels is based on the number of palette color levels, and the contour values are based on the palette level values.
EnSight uses a variable's color palette to convert numbers to colors, while you, the viewer, use them in the opposite manner - to associate a visible color with a number. If you wish, EnSight can display a color-value legend in the Main View window.
At least one color palette - the Coordinate color palette - always exists, even if your model has no variables. In addition, EnSight creates a color palette for each constant per part, real scalar and real vector variable that you activate, giving the color palette the same name as the variable. If the variable is a vector variable, the default color palette uses the vector's magnitude. Constant and Tensor variables have no palette.
Default color palettes have five color levels. Ranging from low to high, the colors are blue, cyan, green, yellow, and red (the spectral order). The numerical values mapped to these five levels are determined by first finding the value-range for the variable at the current time step when the variable is activated. The value for the lowest level is set to the minimum value. The value for the highest level is set to the maximum value. The three middle levels are spaced evenly between the lowest and highest values. For datasets with only one time step, the scheme just described works well because the variable's value range is not changing over time. However, if you have transient data, the range could vary widely at different times and since the default was based on one time step, it may not be appropriate for other time steps. EnSight can show you a histogram of the variable values over time to assist you in setting a palette for transient cases.
The value range for the palette is defined when the variable is activated. The range is initialized such that the min/max cover the variable range for the currently defined parts. The range is not changed by EnSight if you add new parts in the future but you do have the ability to initialize the palette based on the variable extreme, the selected parts, and visible geometry in a specified viewport.
A color palette can have up to 21 levels at which the variable value is specified. Each color palette level's value must be between the value at the adjoining levels. You select whether the scale is linear (the default), quadratic (2 x), or logarithmic (log10).
Sometimes you may wish to only visualize areas whose palette-variable values are in a limited range. You can choose to visualize other areas with a different, uniform color, or to make those areas invisible.
The Palette Editor allows you to manage your color palettes. You can copy, save to a file, and restore from a file existing palettes. You can also edit the palette. To see the Palette Editor dialog, click the button in the Quick Action Icon Bar at the top.
Clicking the button opens the Palette Editor dialog.
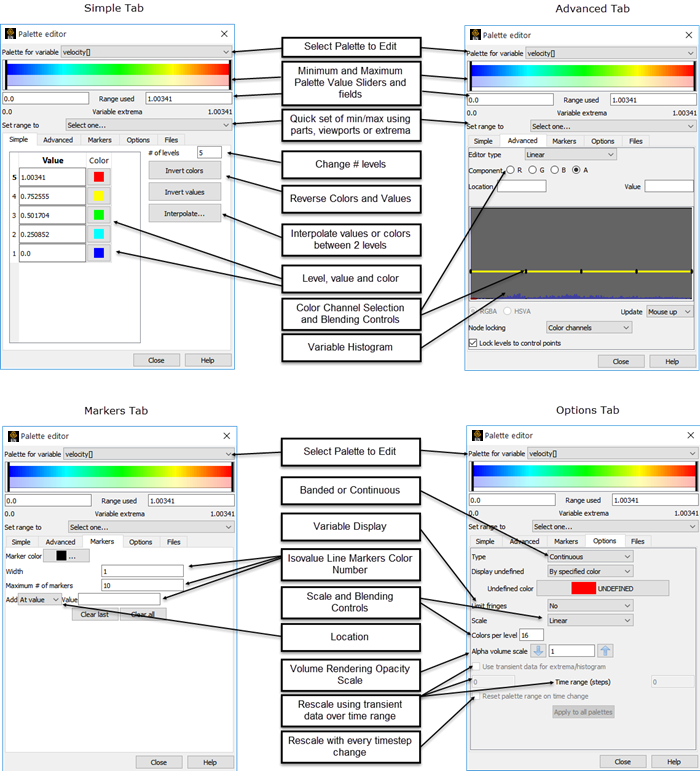
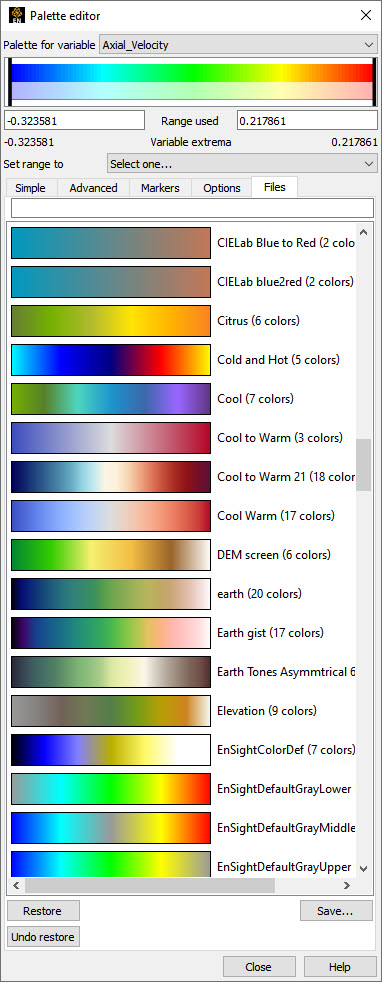
The Palette editor includes over 200 palettes with EnSight accessible through the tab.
- Palette
Select the variable palette to be edited
- Color Palette
This horizontal color legend shows the color range for the palette selected. The left and right black vertical lines indicate the current min/max values in use in reference to the variable extrema and can be clicked/dragged to adjust the minimum and maximum values in use.
- Range Used
Specifies the minimum and maximum values to be used for the bottom and top levels in the palette respectively
- Set range to
The minimum and maximum values associated with the palette can be set to one of the following
- Extrema
Sets the minimum and maximum palette range values to a static value which is the variable's minimum and maximum value at the current timestep. This is value can be set using the variable's minimum and maximum value over all time under the Options Tab by toggling on Use Transient Data for Extrema/Histogram. The min and max can be reset each timestep under the Options Tab by toggling on Reset Palette Range on Time Change.
- Selected Parts
Does a one-time reset of the minimum and maximum palette range values using the viewable elements on the screen of the selected parts (blanking and part element representation affect this range). If you change time you will need to select this option again to reset the min and max to the selected parts variable min and max.
- Current Viewport
Sets the minimum and maximum palette range values using the currently visible elements in the current viewport (blanking, part element representation, and transformation will all affect this range). If you change time you will need to select this option again to reset the min and max to the current viewport variable min and max.
- Value/Color Matrix
You can type new values into each numeric field to adjust the value associated with a color. If you click the color swatch for any level a color selector dialog will appear allowing you to set the color at the level indicated.
- # of Levels
This field specifies the number of value levels for the selected palette. Each level will be defined as a value and color in the field at the left of the dialog.
- Invert Colors
Reverses the colors for the palette
- Invert Values
Reverses the values for the palette
- Interpolate...
Brings up a dialog allowing you to interpolate values or colors between two levels.
- Variable Palette
The background of the middle graphic shows the relative number of nodes at which the
- Histogram
Value of the selected variable is within the range represented by a particular value band. The small horizontal line at the far left of the graphic can be used to interactively adjust the vertical scale of the histogram.
- Control Points
By default EnSight will create the same number of control points as there are levels in the palette. Control points can be added or deleted by right clicking on a control point marker. When adding a control point the point will be added half way between the selected point and the one immediately to the right. To decouple the number of control points from the number of palette levels see Lock levels to control points under the Options tab. To adjust the component value at the control point click and drag the control point.
- Editor Type
The control points can control color by straight line interpolation (Linear) or by creating a spline.
- Component
Selects which color channel will be edited via the control points - Red, Green, Blue, or Alpha, or Hue, Saturation, Value, or Alpha, depending on the state of the RGB/HSVA toggle below.
- Location
Indicates the location (the x value) of the selected control point in the range 0 (left side) to 1.
- Value
Indicates the value of the component of the selected control point in the range 0 (off) to 1 (full value)
- RGB/HSVA
Toggle between Red/Green/Blue or Hue/Saturation/Value to represent color.
- Update
Specifies when the update to the scene will occur. Delayed will cause the update to occur when you select the button at the bottom of the dialog. Mouse up indicates that as you modify the control points or min/max range markers in the palette editor that the update will occur when you release the mouse button. And finally, Immediate will update the scene while you modify the control points.
- Node Locking
By default the control points for the color and alpha channels are locked together, that is, if a node is added/deleted it is added to all channels and if the location of a control point is moved it affects the location of all channels. Color channels indicates that only the color is locked together and the alpha control points are independent. None indicates that all color as well as alpha are independent.
Caution: You can not make the node locking more restrictive than the current setting, that is, if you set the node locking to None you will not be able to set it back to either of the two other choices. Also, once you have set this to None, it cannot be set back to Color Channel in the current session of EnSight.
- Lock Levels To
If turned on (the default), the number of control points for the palette will be the same as
- Control Points
The number of levels and they will be uniformly spaced. Turning this off allows you to decouple the number and location of control points from the number of levels.
It is possible to modify a texture entry in the color palette to show a particular color. These inserted colors show up as regions (contours) of constant color in the graphics window. The width of the resulting contour is a result of the marker width as well as the number of colors per level (see Palette Editor Options Tab).
A marker can be added by directly clicking on the horizontal legend in the dialog.
- Marker Color
Sets the color for all defined markers
- Width
Sets the number of texels covered by the marker
- Maximum # of markers
Sets the total number of marker objects that will be stored for the palette
Add
- At Value
Specify the variable value in the Value field which will be inserted as a marker into the palette.
- Uniformly
Specify the number of uniformly spaced markers in the How many field that will be added into the palette
- At Levels
Will add a marker at each level of the palette
- Clear last
Remove the last marker object created
- Clear all
Remove all markers from the palette
- Type
This pulldown allows for the selection of the desired type of color gradation. The options are:
- Continuous
Displays graduated color variation across or along each element interpolating the color across each element based on the value of the variable at the nodes. If the variable tied to the palette is defined at the element centers the result will be a constant color across the entire element (see also Use continuous palette for per element vars option under Edit → Preferences → Color Palettes).
- Banded
Displays discrete color bands across the elements the number of which is controlled by the number of levels and the number of Colors per level.
- Constant
Displays a single color at each element without any blending.
Display Undefined
If the variable is not defined, the element can not be colored according to the color palette. In this case the element will be colored by:
- As zero value
Color associated with the variable value of 0.0
- By part color
Color associated with the constant part color. This is the default.
- By invisible
The element will not be displayed.
- By specified color
Color specified by the Undefined Color.
Limit Fringes
This pulldown allows you to select how you wish to display elements with variable values above or below the minimum and maximum of the color palette. Options are as follows:
- No
Color scalar values that exceed the minimum or maximum of the palette by the same color as associated with the minimum or maximum of the palette. This is the default.
- By Part Color
Color scalar values that exceed the minimum or maximum of the palette by the part's color.
- By Invisible
Color scalar values that exceed the minimum or maximum of the palette using full transparency.
Scale
This pulldown allows you to select the desired type of interpolation in the palette. The options are:
- Linear
Interpolation in the palette is linear
- Quadratic
Interpolation in the palette is quadratic
- Logarithmic
Interpolation in the palette is log base 10
- Colors per Level
Specifies the number of textels that will be used in the texture between each palette level. Typically used with Banded type palettes to set the number of colors that are viewed or with markers to create wider/thinner markers.
- Alpha Volume Scale
For volume rendered parts this factor will scale the control point alpha value by the factor indicated.
- Use Transient Data for Extrema Histogram
Toggle this on and enter the begin and end time in the Time range (steps) field, to use the variable data over the indicated time range to recalculate the histogram and the palette extrema.
- Reset Palette Range on Time Change
Toggle this on and the palette min and max will be reset each timestep using the current timestep min and max values of the variable.
- Apply to All Palettes
This button will apply the reset palette range on time change to all palettes.
EnSight includes over two hundred predefined palettes to help you display your variable variation in a way that communicates your message more quickly and effectively. Loading a Palette is done using the button. You can create your own palettes and save them using the button.
- Restore
Select a palette from the list and click the button to set the colors and levels of the current palette.
- Save...
Will save the current color and level information to a named palette for future use.
Predefined palettes can enable you to more efficiently communicate your message from your data.
The human eye is drawn to vibrant colors. There are several predefined rainbow palettes (EnSightDefaultPalette, ACFD_11_level_contours, ACFD_21_level_contours, bobs_rainbow and reverse_rainbow). There are several pastel and earthtone palettes (DEM_screen, earth, saturn_pastelyellow_to_purple and morning_glory_blue_tan).
In contrast, dull colors such as gray are uninteresting. Several of the predefined palettes are designed with a dull or uninteresting color in the middle (perhaps representing a value near zero) with the vibrant colors at the positive and negative extremes, highlighting the important values of your variable (ACFD_21_Gray_Middle, ACFD_delta_13_level, and ACFD_delta_6_level).
The human eye sees contrast. Alternating dark and light hues, or alternating colors with black provides a strong contrast showing the gradation of your data (lava_waves, rainbow_banded, StarCDpalette15Band, StarCDpaletteAlt20 and StarCDpaletteAlt20Band).
Finally, color deficiency is quite common. Some of the palettes below are useful for various kinds of color deficiency (EnSightColorDef, grayscale, grayscale_banded, grayscale_inverted).