


The Plots/Queries list panel shows both queries (XY data) and plotters (XY plots). As shown in Figure 3.21: Plots/Queries list panel the list panel has groups for Queries and Plotters. All queries are listed as children of the Queries group. The Plotters group lists all plotters. Additionally, each plotter lists the queries it contains. Queries may or may not be assigned to plotters. A query may also be assigned to multiple plotters. The Plots/Queries list panel does not support further grouping. Queries may be dragged and dropped onto plotters to assign and show the query on the plotter.
As with all list panels, selected queries and plotters have a blue background. Feature Panel selected queries and plotters have a pencil icon to the left of their names.
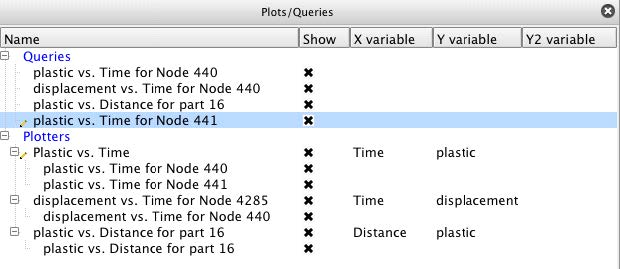
Figure 3.21: Plots/Queries list panel shows the default view for Plots/Queries list panel. By default it shows columns for Name, Show, X variable, Y variable, Y2 variable. These attributes are described in the following section.
The Plots/Queries list panel header context sensitive menu has only the standard two options for Customize... and Fit column widths as described earlier in this chapter.
Selecting the Customize... option from the column header context sensitive menu displays a dialog for choosing which plotter and/or query attributes to display and in what order. Table 3.12: Plotter and Query Attributes lists the available attributes.
Table 3.12: Plotter and Query Attributes
|
Background color |
A color swatch indicating the background color of the plotter. |
|
Background type |
A background type (None or Solid color) of the plotter. |
|
Description |
The name of the plotter or query. |
|
Distance |
The length of the query if it is an over distance query. |
|
Marker color |
A color swatch indicating the marker color on the query. |
|
Marker scale |
The marker scaling factor for the query. |
|
Marker visibility |
An indicator for marker visibility. |
|
Normalize X |
An indicator if the X values have been normalized. |
|
Normalize Y |
An indicator if the Y values have been normalized. |
|
Query color |
A color swatch indicating the color of the query curve. |
|
Query line style |
The query curve line style (Solid, Dotted, Dashed). |
|
Query line type |
The query curve line type (None, Connect the dots, Smooth). |
|
Query offset |
X and Y offset values |
|
Query scale |
X and Y values scale factor |
|
Query width |
The width of the query curve. |
|
Variable 1 |
The name of the Y variable |
|
Variable 2 |
Name of second variable, if applicable |
|
X variable |
The variable shown on the X axis of the plotter. |
|
Y variable | |
|
Y2 variable |
The variable shown on the opposite Y axis of the plotter if two different Y types are plotted simultaneously. |
The context sensitive menu for the Plots/Queries list panel depends on whether the mouse is over a query (see Figure 3.22: Queries Context Sensitive Menu) or a plotter (see Figure 3.23: Plotters Context Sensitive Menu). Table 3.13: Query Options describes the options for queries and Table 3.14: Data Menu Sub-options shows the options for the Data submenus and Table 3.15: Plotter Options describes the options for plotters.
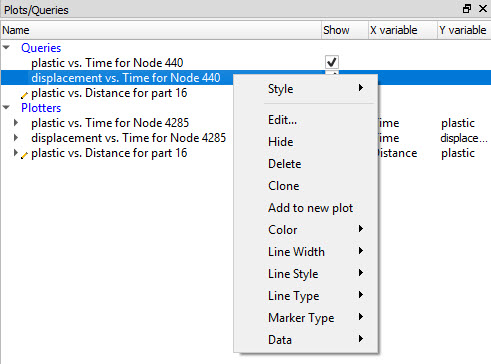
Table 3.13: Query Options
|
Style |
The style manager allows you to copy a selection of attributes (for example, color, linestyle, etc) from one object and apply them to another. Create from object - create a style from this object Copy - Copy this object's style Paste - Paste a previously copied style onto this object Open Style Manager - Open manager |
|
Edit... |
Makes the selected queries Feature Panel selected and opens the Feature Panel if not already displayed. |
|
Hide / Show |
Toggles the visibility of the query. |
|
Delete |
Deletes the query. |
| Clone | Creates a copy of the selected query(ies). |
|
Add to New Plot |
Adds the selected queries to a new plotter. |
|
Color |
Options to set the color for the query. Red, Green, or Blue may be chosen directly or the Color Picker dialog may be selected. |
|
Line Width |
Sets the line width of the query curve. |
|
Line Style |
Sets the line style of the query curve (Solid, Dotted, or Dashed). |
|
Line Type |
Sets the line type of the query curve (None, Connect the dots, Smooth). |
|
Marker Type |
Sets the marker type for the query curve (None, Dot, Circle, Triangle, Square). |
|
Data |
See Table 3.14: Data Menu Sub-options for the options for the Data submenu. |
Table 3.14: Data Menu Sub-options
|
Display |
Displays a dialog containing the query data along with useful metrics. |
|
Copy to clipboard |
Copies the query XY data to the system clipboard so the values may be pasted into another application such as a spreadsheet. |
|
Save to CSV file |
Writes the query XY data to a file in Comma Separated Value (CSV) format. |
|
Save to EnSight XY file |
Writes the query into EnSight's XY format XY Query Data Format. |
|
Save to ASCII file |
Writes the query data into a generic ASCII format |
| Save to report | Save as an ADR Report Object. See Use Reports. |
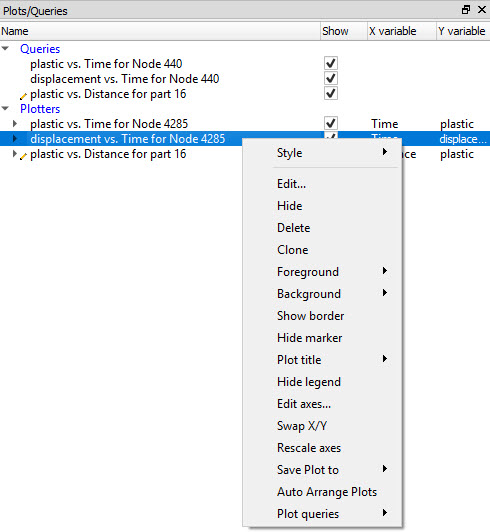
Table 3.15: Plotter Options
|
Style |
The style manager allows you to copy a selection of attributes (for example, color, linestyle, etc) from one object and apply them to another. Create from object - create a style from this object Copy - Copy this object's style Paste - Paste a previously copied style onto this object Open Style Manager - Open manager |
|
Edit... |
Makes the selected plotters Feature Panel selected and opens the Feature Panel if not already displayed. |
|
Hide / Show |
Toggles the visibility of the plotter. |
|
Delete |
Deletes the plotter. |
| Clone | Creates a copy of the selected plot(s). |
|
Foreground |
Options to set the foreground color for the plotter. Black, White, or Grey may be chosen directly or the Color Picker dialog may be selected. |
|
Background |
Options to set the background color for the plotter. None, Black, White, or Grey may be chosen directly or the Color Picker dialog may be selected. |
|
Hide/Show Border |
Toggles the visibility of the plotter border. |
|
Hide/Show Marker |
Toggles the visibility of plotter markers. |
|
Plot Title |
Options to set the plot title color and size via dialogs. |
|
Hide/Show Legend |
Toggles the visibility of the plotter legend. |
|
Edit Axes... |
Makes the selected plotters Feature Panel selected and then opens the Feature Panel to the appropriate panel for adjusting axis attributes. |
|
Swap X/Y |
Swaps the X and Y axes. |
|
Rescale Axes |
Rescales the axes based upon current query data shown in the plotter. |
|
Save plot to |
|
|
Auto arrange plots |
This will automatically arrange all of the visible plots into a uniform grid over the graphics screen area. |
|
Plot queries |
This allows fast, simultaneous changes to all of the queries in a single plot. The following sub-menus are available: Unique Colors - This will color each query a unique color based on its index using a user-selected palette of colors. This selection will pop up a dialog with a single pulldown of all of the available palettes in EnSight. Toggle Markers - If markers are visible, this will toggle markers visibility off. If markers are off then this will toggle marker visibility on and it will assign a list of markers to each query in a round-robin fashion. Toggle Linestyle - If lines are not all solid, then this will toggle linestyle to all solid. If linestyles are all solid then this will toggle a list of linestyles to each query in a round-robin fashion. |