


EnSight provides States which act as a storage container for the attributes of the current objects (for example, viewports, parts, annotations, queries and plotters, and frames). Attributes include object location, color, transformations, layout, etc. States are a handy way of storing waypoints during an involved, interactive analysis that allow you return to previous post processing milestones. They can also be used as an undo mechanism. States can be saved for later use and applied to the same, or similar datasets. And finally, one of the most important uses of a state is its role in supplying content to an EnSight report.
Applying a state does not create new objects; it only modifies attributes of existing objects that match the names of the objects in the state. For instance, it is not possible to create a clip plane by simply applying a state.
It is probably most helpful to use states in conjunction with context or command files (that is, let the context file create all of the objects needed and use the state to set up your objects' location, color, orientation, visibility, scaling, font, etc.).
States can contain sources (images, movies, scene geometry, query data, etc. For details on each source, see Sources which are used extensively for populating report items and are critical component of EnSight reports. For an example usage, see Use States followed by Use Reports.
All of the capabilities for states are accessed through right-click operations only.
The figure shows the States
list panel. It contains the top-level States group,
which contains all the states. Each State has a timestep toggle (default off) which, when
toggled on, causes the State to update the timestep when the State is applied. States may be
dragged and dropped onto the EnSight graphics area to apply the state.
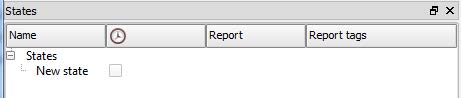
The default view for the States list panel. By default it shows columns for Name,
Time, Report, and Report
tags. These attributes are described in the following section.
The States list panel context sensitive menu allows you to customize the header visibility and to fit the column widths.
Selecting the Customize ... option from the column header context sensitive menu displays a dialog for choosing which viewport attributes to display and in what order. Table 3.20: States Lists Panel Attributes lists the available attributes.
Table 3.20: States Lists Panel Attributes
|
Name |
Editable state name |
|
Time |
Toggle ON and state restores timestep |
|
Report |
Checkbox indicating source is used in report |
|
Report tags |
Metadata text associated with the source in a report |
The figure shows the actions available when you right-click the States group.
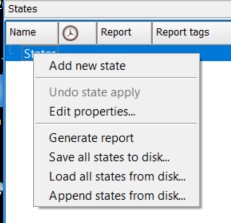
Table 3.21: Menu Actions describes the menu actions.
Table 3.21: Menu Actions
|
Add new state |
Add a new state under the single States group. This new State is assigned the current attributes for all objects at the time of creation. |
|
Undo state apply |
Undo the last state apply operation. |
|
Edit properties... |
Edit the properties of all states using the Edit properties dialog shown in Figure 3.26: Editing Dialog. |
|
Save all states to disk... |
Save all states in an .evs state file that contains the object attributes and their associated values. |
|
Load all states from disk... |
Load all States from a previously saved .evs state file. |
|
Append states from disk... |
Append to existing states additional States read from an .evs State file |
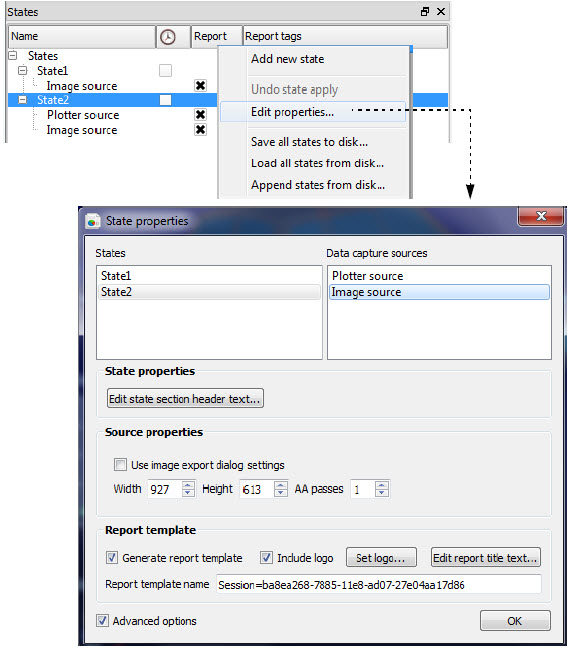
The figure below shows the actions available when you right-click an existing state.
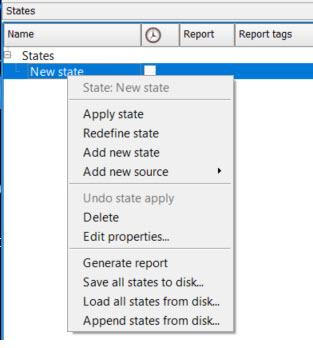
Table 3.22: Context Sensitive Menu Actions describes the context sensitive menu actions.
Tip: Double-click on an existing state to rename it.
Table 3.22: Context Sensitive Menu Actions
|
Apply state |
Apply the state. You can also simply drag a state onto the graphics area to apply it. State attributes for which there are no matching objects are ignored, and objects which are unknown to the state are made invisible. |
|
Redefine state |
Update the state to reflect all the current object attributes. There is no undo for this operation, so you might consider instead making a new state and then redefining the new state. |
|
Add new state |
Add new state. Double click on a state name to rename it. This new state is assigned the current attributes for all objects at the time the new state is created. |
|
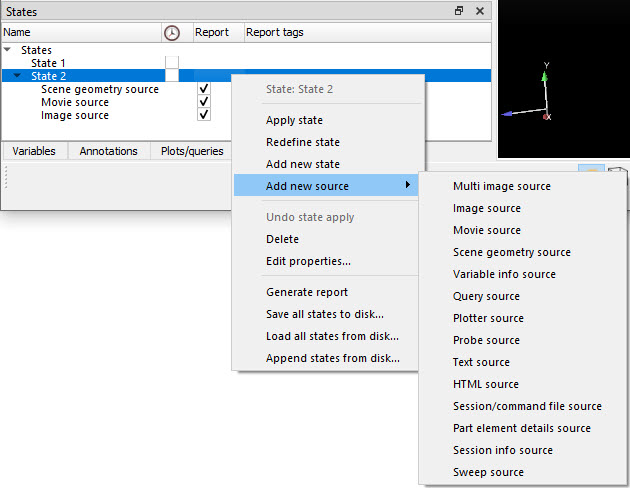
Add new source |
Add new source to this state. Sources are entities that are sent to reports. (For an example of using sources in a report, see Use Reports). The following source types are supported (see Figure 3.25: Adding Sources): Multi image, Image, Movie, Scene geometry, Variable info, Query, Plotter, Probe, Text, HTML, Session/Command file, Part element details, Session info, or Sweep. |
|
Undo state apply |
Undo the last application of any state. |
|
Delete |
Delete the state |
|
Edit properties... |
Edit the properties of all states using the Edit properties... dialog shown in Figure 3.26: Editing Dialog. This is the same dialog that is shown via the top-level States right-click menu. |
| Generate report |
Generate a report (see Use States, see Use Reports). |
|
Save all states to disk... |
Saves all States in an .evs file that contains the object attributes and their associated values. |
|
Load all states from disk... |
Load all States from a previously saved .evs State file. |
|
Append states from disk... |
Append to existing States additional States read from an .evs State file |
Sources associated with a state are sent to EnSight's report infrastructure.
Editing properties displays the States properties window. Toggling on the Advanced options allows you to set the properties of all states, their sources, and the report that includes them. This allows to customize the template that defines the report layout and the sources it includes. When you click on a source, the options shown below it change. For example, when you click on a movie source, the options include movie size, anti-aliasing, frame rate, etc.
Each State contains information needed to restore an EnSight scene. When generating a report, if the state contains a source, one or more items will be sent to the report database. Sources allow you to control the type of items that should be generated and sent to the database for the report. The items that can be generated are of the following type:
Images
Animations
3D scenes
Tables
Texts
Trees
Generic files (The report will display a link to download the file instead of a representation of the file content)
The settings for each source can be modified via the State properties dialog, see Figure 3.26: Editing Dialog for more details.
Multi Image Source
A multi image source generates a collection of images. If no option is selected in the source property dialog, a single image of the current state of the viewport will be generated. If you select one (or more) parts and one (or more) variables from the lists accessible in the Source properties dialog, then one image will be generated for each selected variable, with the selected part(s) colored by that variable.
The collection of images will be displayed in a slider template within the report. One image will be visible at any given moment, and you will be able to view different images by interacting with the slider controls.
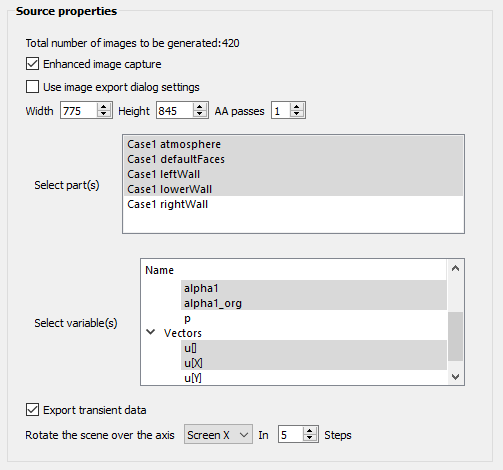
Table 3.23: Multi Image Source Parameters
| Total number of images to be generated | The total number of images that will be generated, given the current properties. Changing the properties will automatically update this value. |
| If toggled on, the image sent to the database will contain extra information
that can be used to query the values of the variables directly in the report. If
toggled off, a normal image will be generated. Note: This option is only available if Rotate the scene over the axis is set to . | |
| If toggled on, values for Width, Height and AA passes will be taken from the Save Image dialog. If off, you can manually modify these values in the Source properties dialog. | |
| Width | Width of the image. |
| Height | Height of the image. |
| AA passes | Number of AA passes of the image. |
| Selected part(s) | Parts to color by the variable(s) selected in the following list. |
| Selected variable(s) | Variables to color the selected part(s) by. One image will be generated for each selected variable. |
| If toggled on, EnSight will cycle through all timesteps and export a set of images for each timestep. If toggled on, the slider in the report will have a Time controller to flip between timesteps. | |
| Rotate the scene over the axis | Rotates the scene and generates extra images for each rotation. While in the
report, dragging the mouse over the image will automatically bring the correctly
rotated image, allowing you to look at the model from different point of views.
Options:
|
| Steps | Number of steps for the rotation. The total rotation will be 360 degrees, therefore each image will be rotated by 360 degrees / number of steps. |
Image Source
An image source generates a single image that reflects what the State shows in the rendering window.
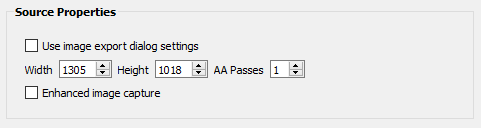
Table 3.24: Image Source Parameters
| If toggled on, the image sent to the database will contain extra information (X&Y location, part name, variable name and variable value) that can be viewed by hovering the mouse over the image that is generated in the report. If toggled off, a normal image will be generated. | |
| If toggled on, values for Width, Height and AA passes will be taken from the Save Image dialog. If off, you can manually modify these values in the Source properties dialog. | |
| Width | Width of the image. |
| Height | Height of the image. |
| AA passes | Number of AA passes of the image. |
Movie Source
The movie source generates a movie item and places it in the report.
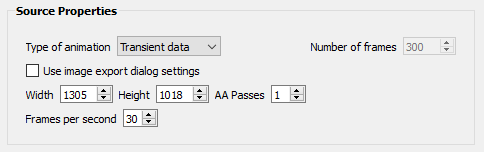
Table 3.25: Movie Source Parameters
| Type of animation | Type of animation to be generated. Options:
|
| Number of frames | Enabled only for Animated traces. Total number of frames in the animation. |
| If toggled on, values for Width, Height and AA passes will be taken from the Save Image dialog. If off, you can manually modify these values in the Source properties dialog. | |
| Width | Width of the image. |
| Height | Height of the image. |
| AA passes | Number of AA passes of the image |
| Frames per second | Number of frames per second of the movie. Default = 30. |
Scene Geometry Source
The scene geometry source generates a 3D scene item (AVZ format) and places it in the report.
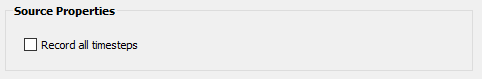
Table 3.26: Scene Geometry Source Parameters
| If off, only the current timestep will be exported to the 3D scene item. If on, the 3D scene item will contain all timesteps. |
Variable Info Source
The variable info source generates a table with information about the dataset variables. The table contains the min and max values for scalar, vector and per case constant variables, and the values on each part for per part constant variables.
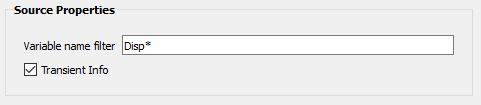
Table 3.27: Variable Info Source Parameters
| Variable name filter | Variables to query. Default is '*', which means all active variables. You can place multiple variable names, comma separated. Only active variables will be queried. |
| If off, only the information for the current timestep is exported. If on, the information for each timestep is exported. |
Query Source
The Query source generates a table with the X and Y values for existing EnSight queries.
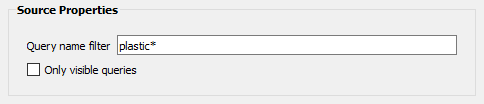
Table 3.28: Query Source Parameters
| Query name filter | Filter for the queries to get X,Y values from. By default is '*', which means all queries. You can place multiple query names, comma separated. |
| If toggled on, restricts the operation only to visible queries. |
Plotter Source
The Plotter source generates a table of X & Y values for existing EnSight plots, to be displayed as a plot in the report.
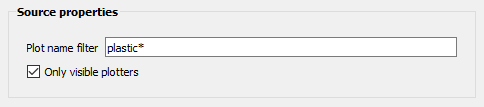
Table 3.29: Plotter Source Parameters
| Plot name filter | Filter for the plotters to get X,Y values and plotting attributes from. By default is '*', which means all plotters. You can place multiple names, comma separated. |
| If toggled on, restricts the operation only to visible plotters. |
Probe Source
The Probe source generates a table where each row is a probe, and the columns are: X,Y,Z coordinates (location of the probe), and the queried variables. No parameters are available for this source.
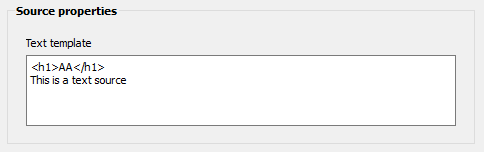
Text Source
The Text source allows you to create a text string to be inserted in the report.
HTML Source
The HTML source allows you to create text to be inserted in the report. It supports HTML formatting.
Figure 3.27: Text Source Properties
Table 3.31: HTML Source Parameter
| Text template | Text to be inserted in the report. HTML formatting is supported. |
Session/Command File Source
The Session/command file source generates a session, command and/or scenario file(s) and adds it to the report as a link. Clicking the link will download the corresponding file. By default, only a scenario file will be saved. The other options need to be enabled manually.
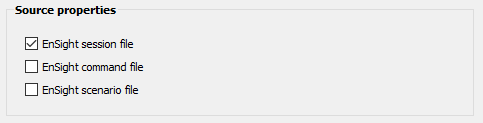
Table 3.32: Session/Command File Source Parameters
| If toggled on, a session file .ens will be sent to the report. | |
| If toggled on, a command file .enc will be sent to the report. | |
| If toggled on, an EnVision scenario file .evsn will be sent to the report. |
Part Element Details Source
The part element details source generates a table with the number of elements of each element type for each part. You can set which parts to query and how to display the information – as a table or as a plot.
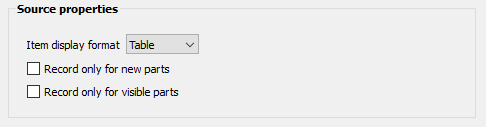
Table 3.33: Part Element Details Source Parameters
| Item display format |
Set how to display the data. Options available:
|
| If toggled on, only created parts will be queried. | |
| If toggled on, only visible parts will be queried. |
Session Info Source
The session info source creates a tree object that contains information about the currently loaded EnSight session. The session information includes:
Case name
Reader
Loaded file
Parts: all the parts. For each part, list the type of elements it is composed of, and how many elements for each type.
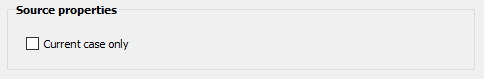
Table 3.34: Session Info Source Parameter
| If toggled on, only current case information will be pushed to the report. If off, information about all loaded cases will be pushed to the report. |
Sweep Source
The sweep source generates a collection of images where a clip or an isosurface part have their value changed from a minimum to a maximum value, through a number of steps defined by you. The swept part will be colored by different variables, which you can control via the source parameters. The images will be collected in a slider template within the report. By default, one image will be visible at any given moment, and you will be able to flip through all the generated images via the slider controllers. If image comparison is enabled, two sets of images will be displayed at the same time, with their own specific slider controls. This allows you to quickly compare images generated by this source.
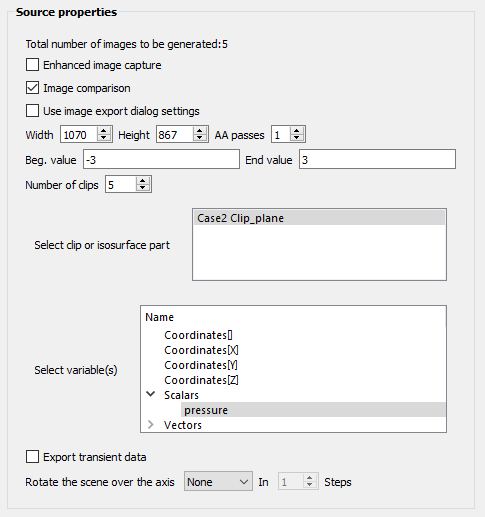
Table 3.35: Sweep Source Parameters
| Total number of images to be generated | The total number of images that will be generated, given the current properties. Changing the properties will automatically update this value. |
| If toggled on, the image sent to the database will contain extra information
that can be used to query the values of the variables directly in the report. If
toggled off, a normal image will be generated. Note: This option is only available if Rotate the scene over the axis is set to . | |
| If toggled on, the report will show two sets of images, side by side, to allow
you to compare the images. Note: This option is only available if Rotate the scene over the axis is set to . | |
| If toggled on, values for Width, Height and AA passes will be taken from the Save Image dialog. If off, you can manually modify these values in the Source properties dialog. | |
| Width | Width of the image. |
| Height | Height of the image. |
| AA passes | Number of AA passes of the image. |
| Beg. value | Beginning value for the clip / isosurface sweep. The clip / isosurface value will change between this beginning value and what is set in the end value field. |
| End value | End value for the clip / isosurface sweep. The clip / isosurface value will change between what is set in the beginning value and this end value. |
| Number of clips | Number of sweep positions. The clip / isosurface part value will go from the beginning to the end value, with a constant delta calculated in order to generate the number of images set by this parameter. |
| Selected clip or isosurface part | Select one part, which will be modified according to the other source parameters. Only clip or isosurface parts are allowed. |
| Selected variable(s) | Variables to color the selected part by. One image will be generated for each selected variable. |
|
If toggled on, EnSight will cycle through all timesteps and export a set of images for each timestep. If toggled on, the slider in the report will have a Time controller to flip between timesteps. | |
| Rotate the scene over the axis |
Rotates the scene and generates extra images for each rotation. While in the report, dragging the mouse over the image will automatically bring the correctly rotated image, allowing you to look at the model from different point of views. Options:
|
| Steps | Number of steps for the rotation. The total rotation will be 360 degrees, therefore each image will be rotated by 360 degrees / number of steps. |