


EnSight provides a full-featured X-Y plotting system fully integrated with the query and transient data handling capabilities. Query entities (see Query/Plot) are assigned to plotters. Plotters display one or more curves where each curve is based on the data from a single query entity. If the query entity is changed, the corresponding curve will automatically update. Plotter (controlling aspects of appearance such as color of curves and titles, axis labeling, gradation and tick marks, and border/background color) can be edited through the Quick Action icon Bar or the Feature Panel.
This article is divided into the following sections:
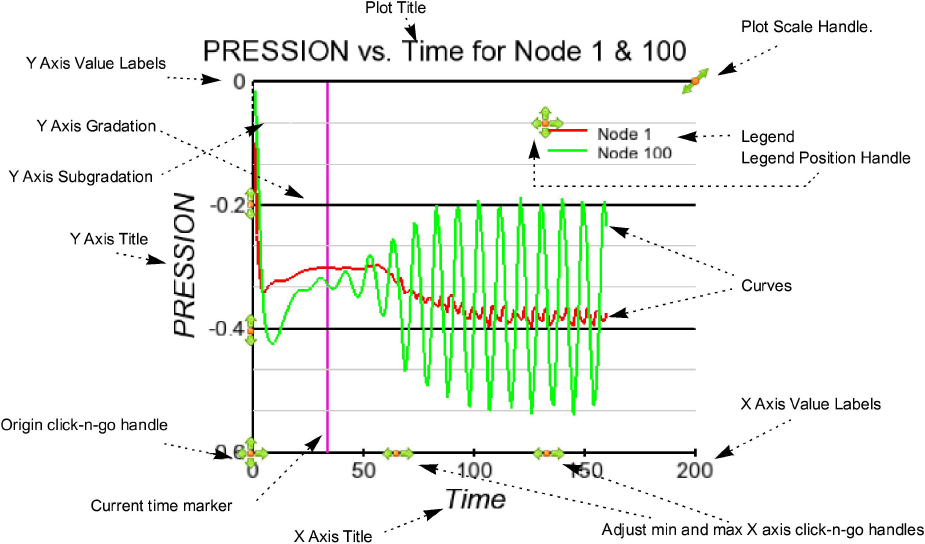
Plotters are automatically created when you assign a query entity to a new plotter (see Query/Plot for details). Also, by default when you create a query it is automatically plotted.
Any action to change plotter always operates on the currently selected plotter(s) (or the plotter defaults if none are selected). To select plotters:
Left click on the plotter in the Plotters list.
OR
Move the mouse pointer into the Graphics Window and click the left mouse button anywhere on the plotter axis or titles
Curves have one set of attributes even though they may be plotted on multiple plotters. To select curves:
Left click on the query in the Queries list.
OR
Move the mouse pointer into the Graphics window and click the left mouse button on the desired curve. You can add to an existing selection by holding down Ctrl as you click on additional curves.
Plotters can be easily moved and resized. You can either reposition a plotter with the mouse in the Graphics Window, or precisely by entering exact values. To move or resize a plotter interactively:
Move the mouse pointer over the plotter. The touch-n-go handles will appear.
Click and drag anywhere on the plotter to move it.
To resize the plotter move the click and drag the resize handle in the upper right corner.
Right-click at the plot origin and choose ‘Auto Arrange Plots’. All of the visible plots (up to 16 plots) will be automatically arranged into a grid of plots (of dimension row x column) which is 2x2 for 2-4 plots, 3x2 for 5-6 plots, 3x3 for 7-9 plots, 4x3 for 10-12 visible plots, 4x4 for more than 12 visible plots. If more than 16 plots, this will only automatically arrange the first 16 into a 4x4 grid of plots.
A plotter can also be positioned precisely. See below for details.
Click to select a plotter. The Quick Action Icon Bar configures to display plotter which may be modified.
Plotters that are currently invisible are displayed dimmed if Limited redraw is enabled.
Overall of plotters are controlled through the Plotter Feature Panel:
Double-click on a plotter in the Plotter list (or right click to ) to bring up the Feature Panel.
The Plotter Specific dialog contains six sections: Background, Border, Legend, Position, Marker, and Title. Open the turn-down section for the required function.
The Background section controls the type and color of the plotter background:
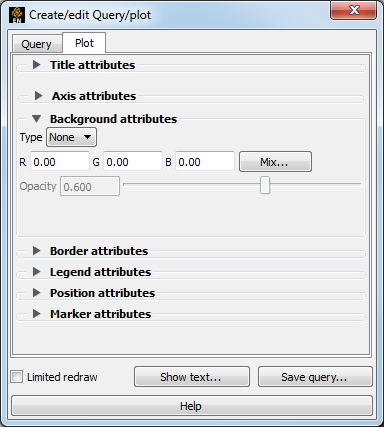
Set background type to either None or Solid. A solid background is opaque.

If the background type is Solid, set the color (either enter new values in the RGB fields or click the button to open the Color Selector dialog (Use the Color Selector)).

You can also control the background opacity.

The Border section controls the visibility and color of the plotter border:
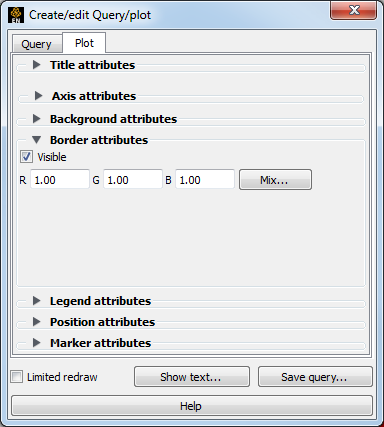
Toggle border visibility.

Set border color (either enter new values in the RGB fields or click the button to open the Color Selector dialog (Use the Color Selector)).
The Legend section controls the plotter legend text. The actual text in the legend is the name of the individual curves in the plotter. See Set Curve below.
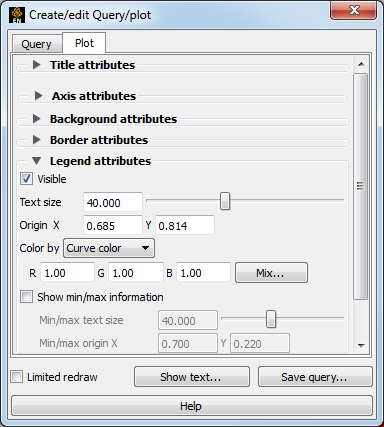
Toggle legend visibility.
Set Text size.
Set Origin (with respect to lower left corner of plotter).
The legend text can be constant colored or the color of the curves. If set to constant color set text color (either enter new values in the RGB fields or click the button to open the Color Selector dialog (Use the Color Selector)).
The Position section controls the size and position of the plotter:
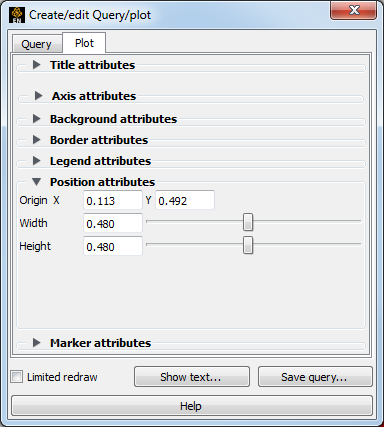
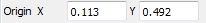
Set the origin of the plotter (with respect to the lower left corner of the Graphics Window).
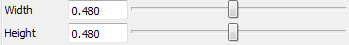
Set the plotter width/height (0-1 normalized to the width and height of the Graphics Window).
The Marker section controls whether the curves will animate and whether the plot will be swept out during the animation or whether a time marker will sweep along the curve in the plotter:
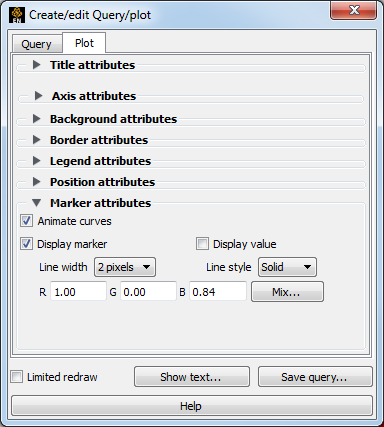
Select Animate curves if you want the curve to be swept out or a time marker to be swept along the curve during animation.
Toggle Display marker if you want a vertical line to show time/distance value corresponding to the query marker in the graphics window. For time queries the marker will sweep as time updates.
You can control the line width, style, and color of a time marker.
Display value will show the value of the x and y axis of where the marker intersects the curves on the plotter.
The Title section controls the main title at the top of the plotter:
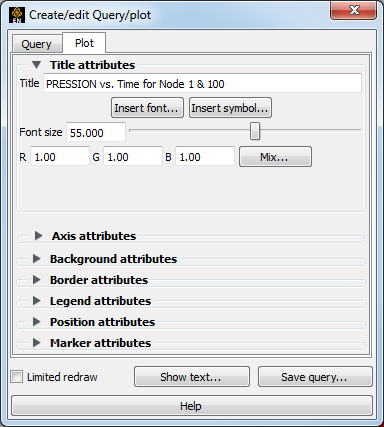
Set title text.

Set the size of the title text.

Set the text color (either enter new values in the RGB fields or click the button to open the Color Selector dialog (Use the Color Selector)).
If you desire special symbols, click Insert symbol..., pick the symbol(s) and pick the symbol out of the pop-up window.
Axis of a plotters are controlled through the Axis section of the Plotter Feature Panel.
The Axis turndown contains two sections: General and Specific. Select the tab to display the corresponding section.
The General section controls axis width, color, and scaling as well as Gradation and Subgradation marks.
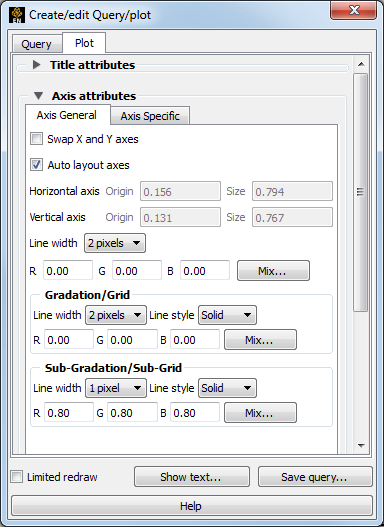
Swap X and Y axes swaps the X and Y axis on the plotter.
Auto layout axes will insure that the various components of the plotter (title, axis description, values, etc.) don’t overlap.
Horizontal axis and Vertical axis specifies the axis origin (vertical and horizontal) within the plotter area. These will be grayed out if Auto layout axes is enabled.
Line width sets line width of axes.
RGB sets color of axes.
Line width, Line style and RGB set line width, style, and color for major gradations (gradations are enabled on a per-axis basis in the X-Axis and Y-Axis sections).
Line width, Line style and RGB set line width, style, and color for subgradations (subgradations are enabled on a per-axis basis in the X-Axis and Y-Axis sections).
The Axis Specific section controls the title, value labels, and gradation marks for the X or Y axis.
Modify axis chooses which axis to deal with - you can select x or y or both.
Visible toggles visibility of the axis line.
Title sets the title of the axis.
Font size sets the size of the title of the axis.
RGB sets the color of the title of the axis
Type sets the type of axis label: None (show no value labels), All (show value labels at each gradation), or Beg/End (show only the first and last value labels).
Size sets the size of the axis value labels.
Scale sets the scale to linear or logarithmic(log10).
Axis Auto Scaling sets auto scaling - when on, the Min/Max values and the number of gradations will be used as suggested values to arrive at pleasing numbers for the axis labels.
Min/Max sets the min/max range of the variable displayed on the axis.
Note: Used as exact values only if the Auto Axis Scaling toggle is off).
Format sets the display format of the value labels (or click Format... to select common formats from a list).
RGB sets the color of the axis value labels.
Grad Type sets the type of gradation: None (no gradation marker), Grid (a vertical line), or Tick (a mark on the axis at the value label positions).
Grad Type # of sets the approximate number of gradations (also depends on the min/max range).
SubG Type sets the type of subgradation: None (no subgradation marker), Grid (a vertical line), or Tick (marks on the axis between the value label positions).
SubG Type # of sets the number of subgradations between each value label By swapping the min and max can swap the positive direction.
Curve and marker are controlled through the Query tab of the Query/plot Feature Panel:
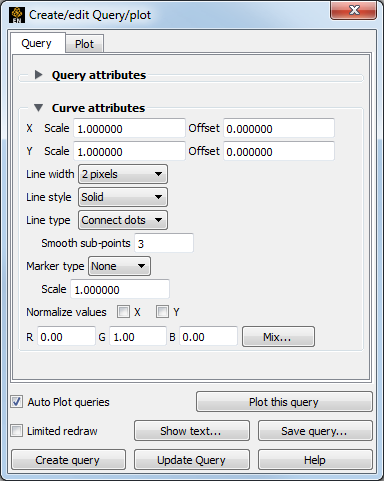
Select the desired curve(s) by clicking on them in the Graphics Window or selecting them in the Query list (control-click to select multiple curves).
Right click in the Query list to Edit
OR
Double click on a query in the Query list.
To bring up the Query tab of the Feature Panel.
If desired, you can apply an offset and scale factors to your x and/or y data using X Scale and Y Scale Offset. The offset value is added to the query value then the sum is scaled by the Scale factor.
Line width sets the line width.
Line style sets the line style.
Line type sets the line type: None (only curve markers are drawn), Connect Dots (data points are connected by straight lines), Smooth (a piece wise spline is fit to the data points using the number of points specified in the Smooth Sub-points field).
Marker type sets the marker type.
Scale sets the size of the markers.
Normalize values normalizes x and/or y values, if desired.
RGB sets the color of the curve.
Existing plotters can be deleted:
Select the plotters
Right-click on the Plotters list to Delete
Note: Deleting a plotter has no effect on any query entities that were attached to the plotter.
If a plotter has many curves, it is nice to be able to change all the curves.
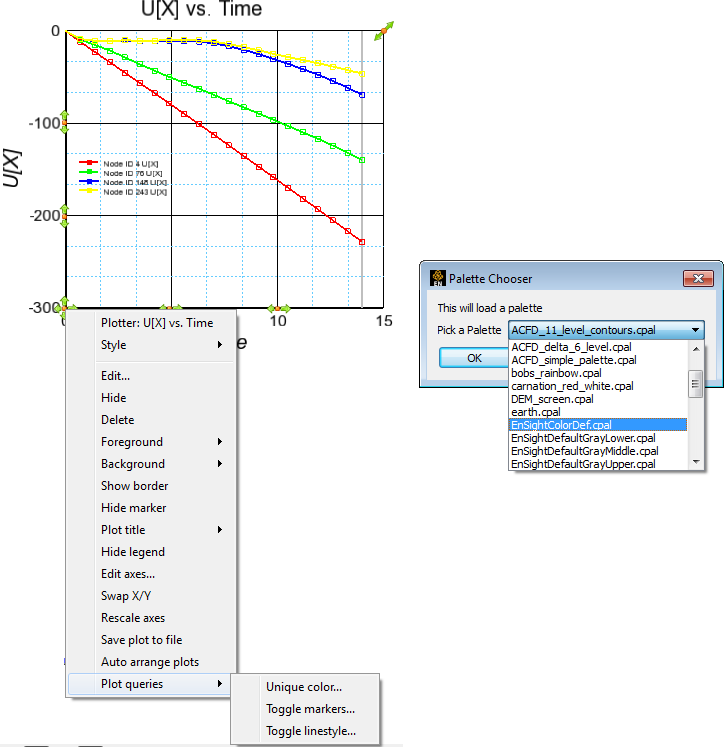
Right click on the plotter origin. You should see the name of the plotter at the top of the pulldown if you have right-clicked directly on the origin.
Choose Plot queries
will pop up a dialog with a pulldown list of available palettes available in EnSight and then assign the color of the curves using the palettes. These are the same palettes files available in EnSight to color variables, allowing some level of creativity. For more information on palette files, see Palette Editor Files Tab.
will toggle all markers off if any are on. It will toggle all markers on if any are off, and will round-robin assign the markers a shape.
will toggle all lines to solid if any are not solid. If all are solid it will round-robin assign the markers a line style.