


The previous section stepped through a sample analysis and provided a broad overview of using EnSight within the Workbench workflow. What follows is a more detailed look at the Workbench graphical user interface as it relates to EnSight. Some of the content is repeated for the advanced Workbench user who skips the sample analysis and wants to dive into the details.
Reminder, if the EnSight extension is not shown in the list of Component Systems in the Toolbox Workspace then it must be loaded as a Workbench extension as follows. Choose, from the Workbench menu, Extensions → Manage Extensions... which will pop up the Extensions Manager dialog. Toggle on the EnSight Extension, and then right-click EnSight and choose Load as Default. Now, quit Workbench. Restart Workbench and verify that EnSight appears in the Toolbox under the Component Systems pulldown.
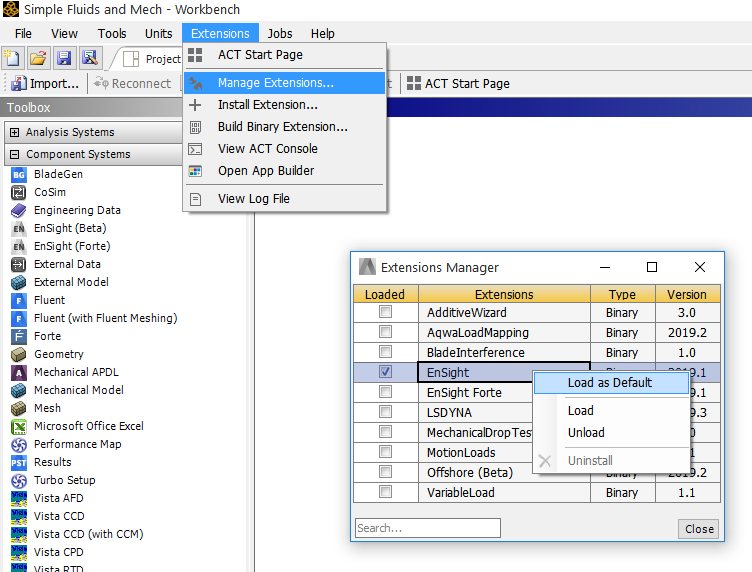
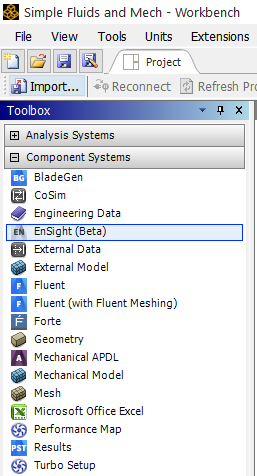
After choosing to Load as Default, the EnSight as a Workbench extension, and then restarting Workbench, you should now see EnSight in the Component Systems pulldown in the Toolbox Workspace as follows:
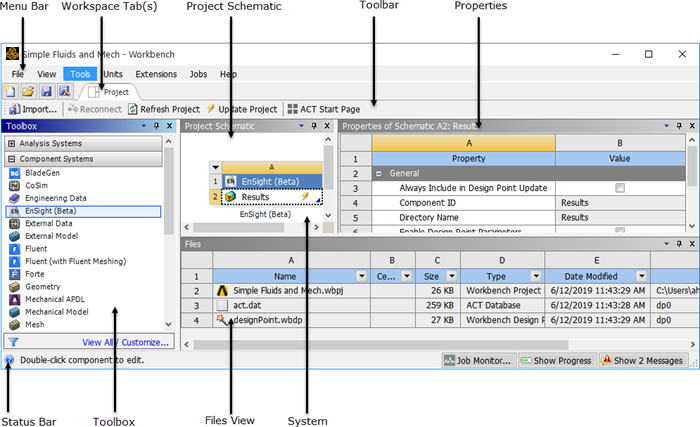
Now let's look at the Workbench GUI in more detail. Shown below are the components of Workbench. Workbench has a top-level Menu Bar, and a lower Status Bar and one or more Project Tabs. Each Project Tab has a Toolbar, with a number of Workspace Views, some of which are shown below: the Toolbox Workspace, Properties View, Files View and the Project Schematic Workspace. The Project Schematic is where Systems from the ToolBox are assembled together into a Workflow. Some of this will be discussed in this section as it pertains to EnSight.
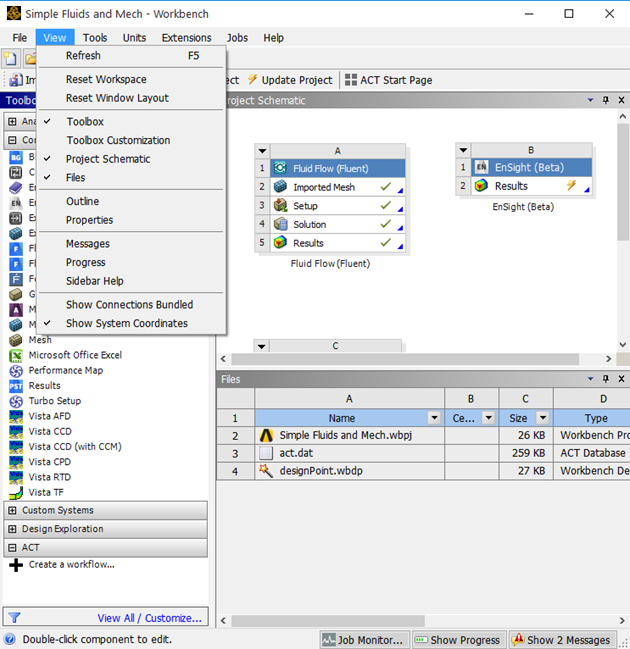
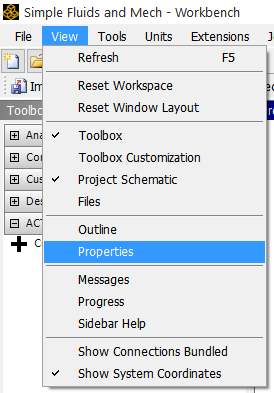
You control which views are displayed by choosing View from the top menu and choosing the view you want to display.
Note: The Toolbox and the Project Schematic are displayed by default.
For the following View, first select a cell, then choose one of the following other views from the top level View menu, and the workspace corresponding to the selected cell will appear: Toolbox Customization, Files View, Properties View, Messages View, Progress View, Sidebar Help View. If you minimize a view (on the Title Bar, right-click Minimize), it appears as a tab in the View bar and the check box is cleared from the View menu. For more details on workspaces and tabs, see Tabs within Workbench in the Workbench User's Guide and Views within Tabs in the Workbench User's Guide. Now, let's look at several Workspaces and Views.
Select the EnSight Results.
From the top menu bar, → .
Pops up the dockable/undockable Files Workspace.
The list on the left is the Toolbox; by default viewing is toggled on for the Toolbox. The Toolbox contains four pulldowns containing systems available to you: Analysis Systems, Component Systems, Custom Systems, and Design Exploration, which are discussed below.
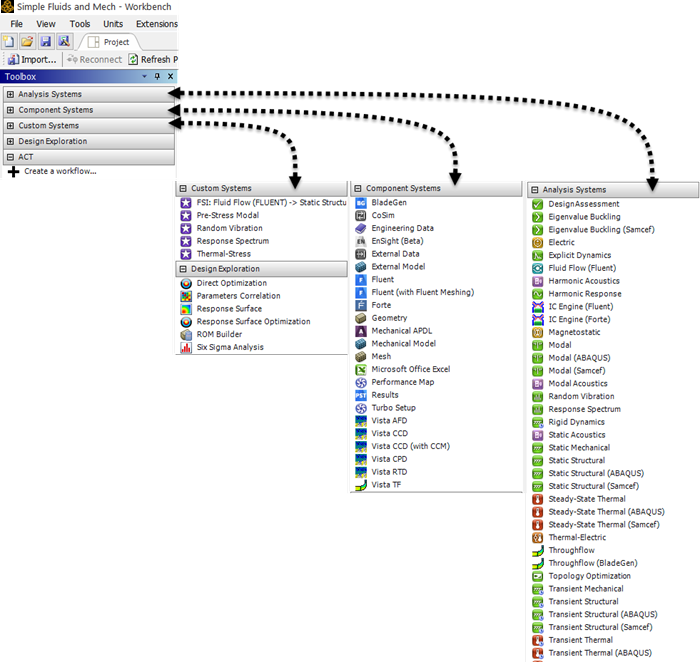
Analysis Systems — The Analysis Systems pulldown contains applications that transform input and solve particular types of problems, often resulting in transformed output. These systems can be thought of as of the kind of solution that is desired packaged with the Solver. For example Eigenvalue Buckling system is a modeling, a meshing, a modal frequency buckling analysis and a visualization process packaged with Ansys Mechanical. Similarly, the Fluid Flow (Fluent) system contains tools for creating the geometry, performing the meshing, setting up the solver, using the solver to derive the solution, and viewing the fluid flow results.
Component Systems — The Component Systems pulldown contains extensions that are loaded into Workbench that also solve particular types of problems similar to the Analysis Systems. In particular, you will see the EnSight Extension under this pulldown. EnSight is available to input solution results and to interactively Analyze, Visualize and Communicate these solution results and create postprocessing output such as tables, movies, images, or data files.
Custom Systems — The Custom Systems pulldown contains customized applications that combine multiple analysis systems. For example, the FSI: Fluid Flow (Fluent) → Static Structural system combines Ansys Fluent and the Mechanical application to perform a Fluid Structure Interaction (FSI) analysis.
Design Exploration — The Design Exploration pulldown contains systems that enable you to see how changes to parameters affect the performance of the system.
Note: Which systems are shown in the Toolbox depends on the licenses that exist on your system. You can hide systems by enabling View → Toolbox Customization and clearing the check box beside the name of the system you want to hide. To begin using a system, drag it into the Project Schematic area.
The Project Schematic enables you to manage the process of your work flow; by default viewing of the Project Schematic is on. It keeps track of your files and shows the actions available as you work on a project. At each step you can select the operations that process or modify the case you are solving.
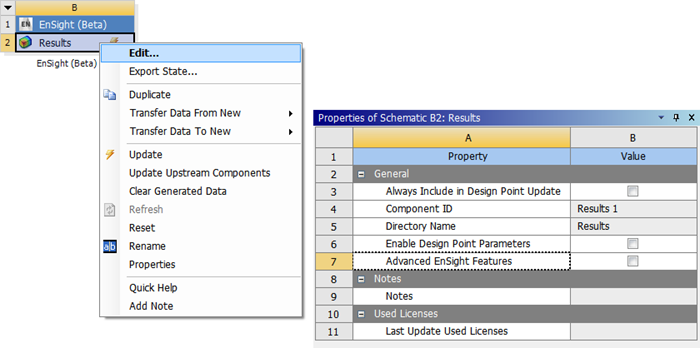
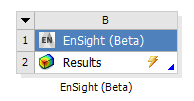
When you move a system from the Component Systems toolbox to the Project Schematic, you will see a system similar to the following:

Each white cell represents a step in solving a problem. Right-click the cell to see what options are available for you to complete a step. For example, you would select Edit in the example above on an EnSight Results cell to launch EnSight and load solution data, or Properties to open the EnSight Properties table to enable optional EnSight capabilities.
Load Results using EnSight.

Toggle on Advanced EnSight Features to expose other options.
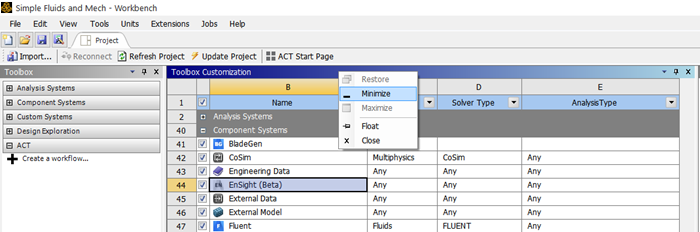
View → Toolbox Customization will view the Tool Customization Workspace in a tabular form, as shown below. This allows you to customize the Physics, Solver Type and Analysis Type of the particular application or extension according to your workflow needs as shown below. Right-click Minimize on the Toolbox Customization title bar, to reduce the workspace table down to a tab below the Toolbox list. Right-click Close to close the Toolbox Customization workspace.
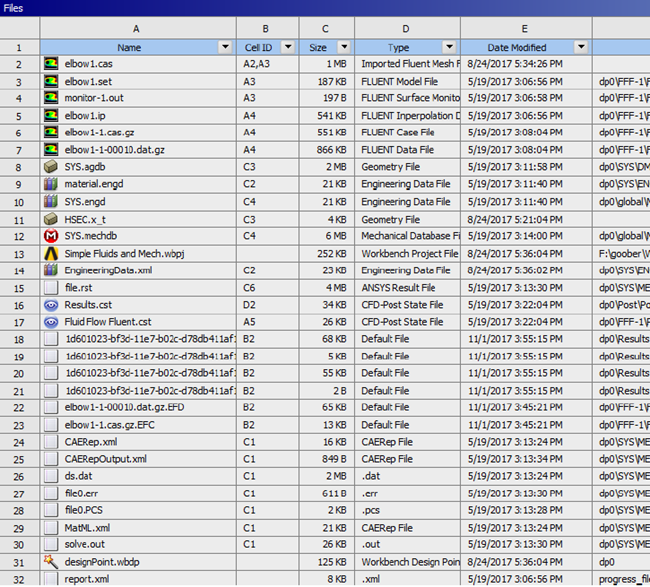
The Files view (View → Files) shows the files that are in the selected cell of a given System. The project files are updated constantly, and any save operation from a component will save all files associated with the project.
Ansys Workbench associates data with system cells. This data may be stored in different ways, including as part of the Ansys Workbench project file or as separate files. When files are generated, they appear in the Files view. This view can be used to identify which files are associated with each cell.
On the title bar, right-click Minimize or right-click Close to minimize this file Workspace to a tab or to close it, respectively.
Important: Although the Files View reveals the data files that make up a project, you should not attempt to manipulate these files directly, as project data management will proceed unaware of your changes and with unpredictable results.
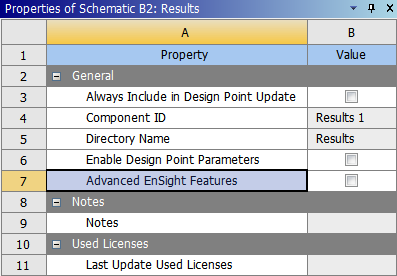
The Properties view is a table whose entries describe the status of a system. These entries vary between system cells and are affected by the status of the cell. Some entries in the Properties area are changeable; others are for information only. To display the Properties for a particular cell, right-click the cell and select Properties, or click the cell to select it, and in the top menu, View → Properties.
Note: Once the Properties view is open, simply selecting another cell in the Project Schematic will display its properties. Right-click on the Toolbar and choose Close to close the window, or minimize to reduce it to a tab.
EnSight Example
For example, to adjust EnSight properties, select the EnSight Results (click the EnSight Results) and in the top menu, View → Properties. Toggle on the Advanced EnSight Features toggle to see the available properties and their settings. The Use Software Rendering toggle is available in the rare instance that EnSight is unable to adjust its rendering mode due to graphics incompatibilities; toggle this on to force EnSight to use internal software rendering in order to manually bypass hardware or software graphics card rendering problems. The Enable Beta Features toggle exposes two features under development: units labeling (for details, see EnSight Limitations within Ansys Workbench) and the ADR report interface.
Select EnSight Results.
From the top menu, → .
Toggle on Advanced EnSight Features to expose other toggles.
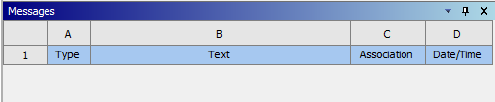
The Messages view shows the messages to the user. For example, click the EnSight Results in the Project Schematic to select it, and in the top menu, View → Messages.
On the title bar, right-click Close to close the Messages view workspace.
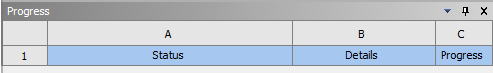
The Progress view shows the progress to the user. For example, click the EnSight Results in the Project Schematic to select it, and in the top menu, View → Progress.
On the title bar, right-click Close to close the Messages view workspace.
In the top menu, View → Sidebar Help. Click this link.
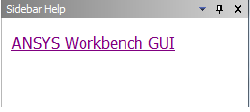
In addition to having a visual layout that guides you through completing your project, you can also access Sidebar Help by pressing F1 while the mouse focus is anywhere on Ansys Workbench. Sidebar Help is a dynamically generated set of links to information appropriate for helping you with questions you have about any of the tools and systems you currently have open.