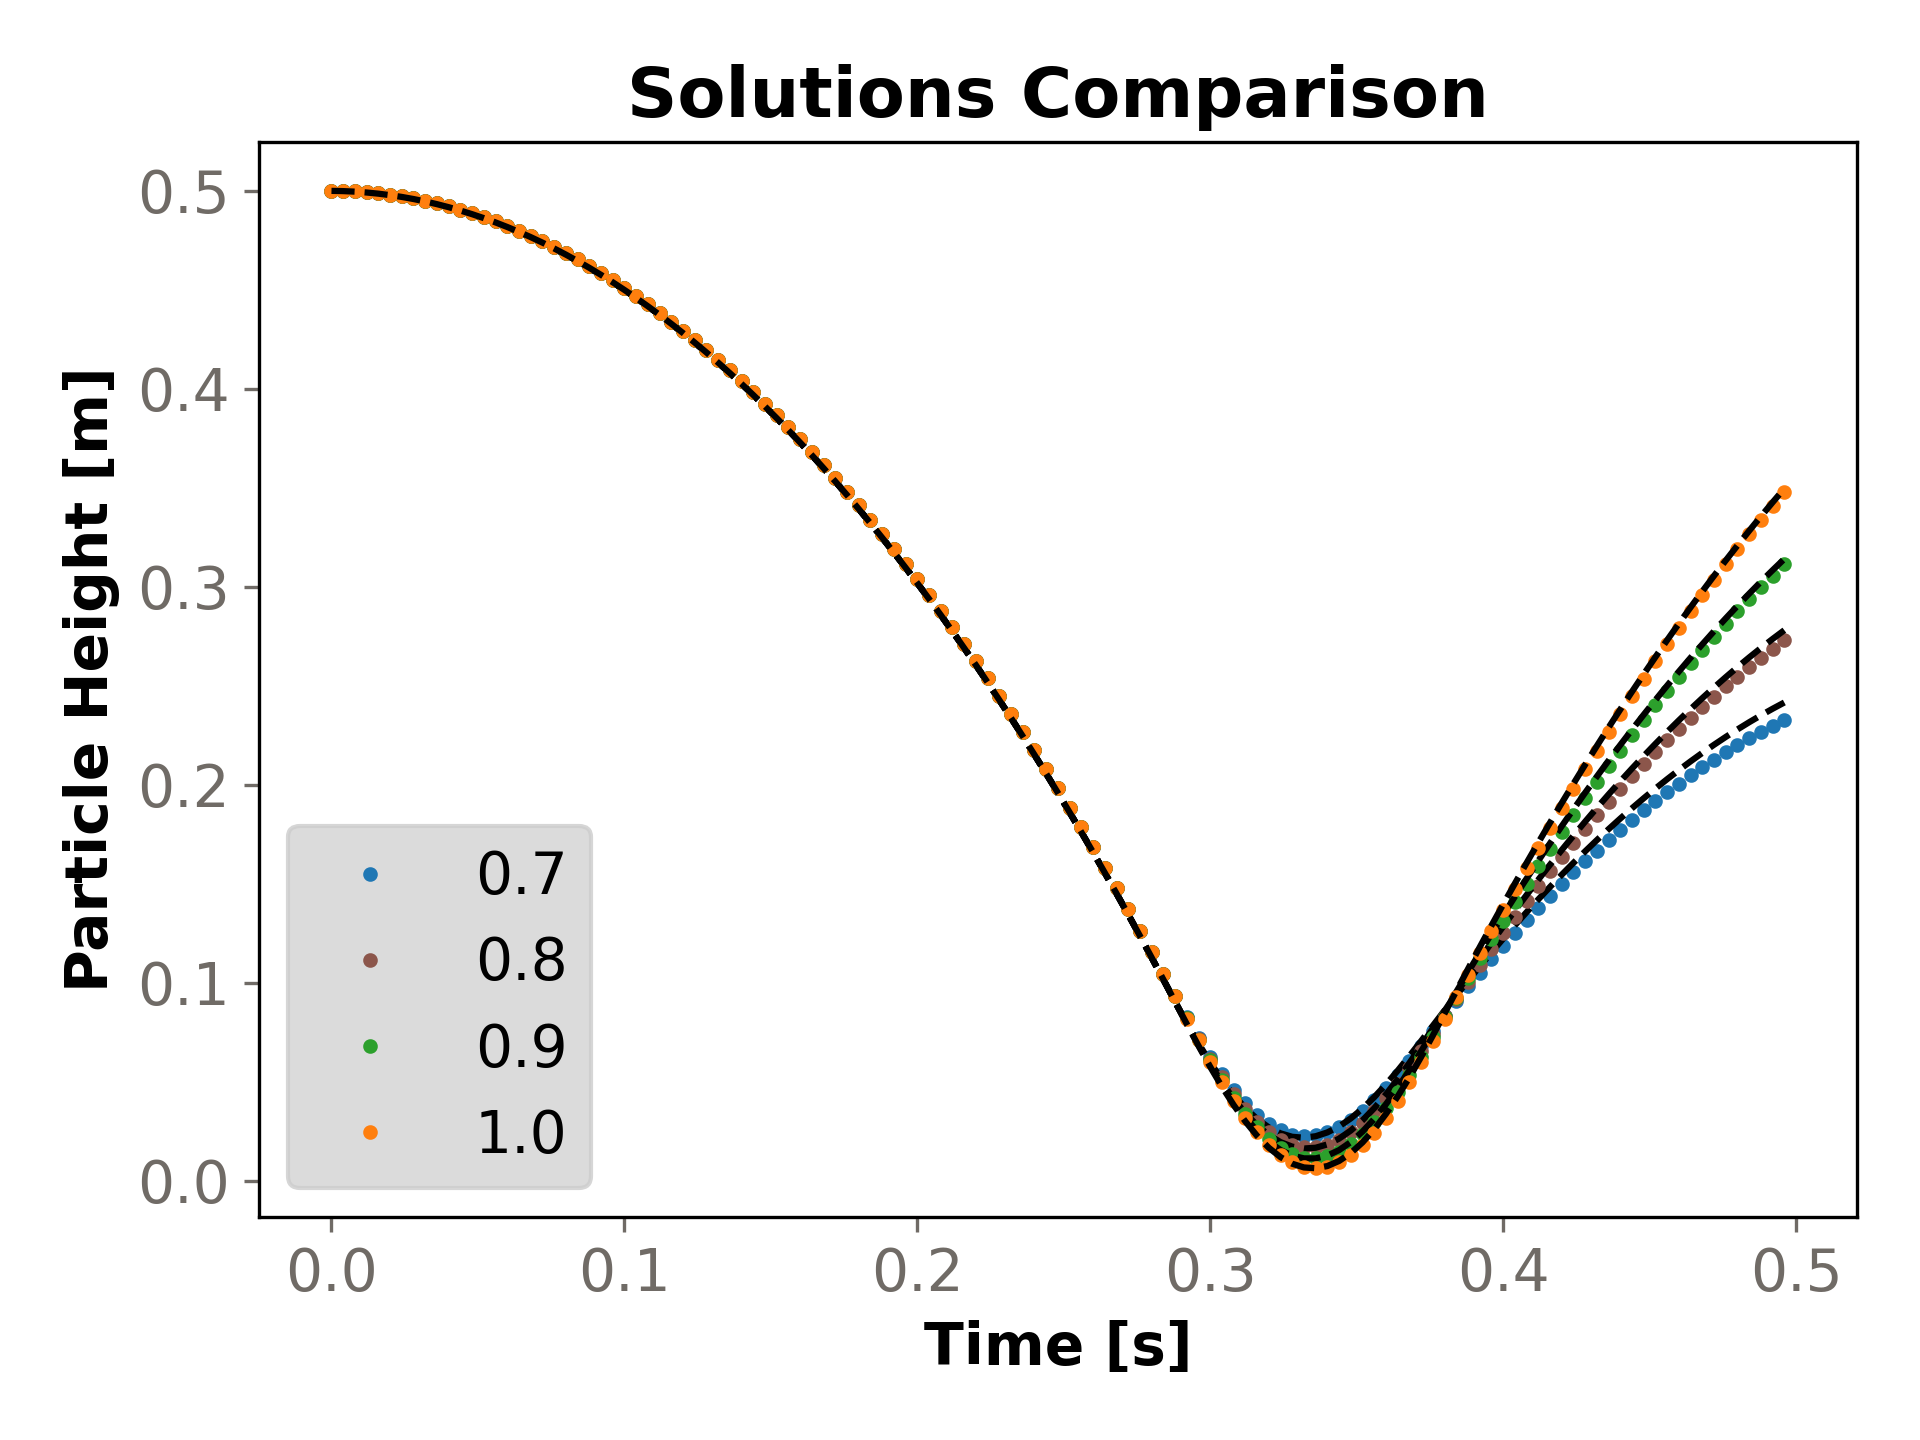
After running the simulations using the parameters described in the previous section, it is possible to compare the results between Rocky and the Analytical solution. The evolution of the particle height (measured from its center position) is shown in Figure 2.17: Evolution of the height of the sphere for the first bounce. for different coefficients of restitution, labeled from 0.7 to 1.0. This figure presents the analytical results in the dots, and the numerical results from Rocky as dashed lines. It can be seen that the higher the restitution coefficient, the better the correlation between numerical and analytical results, and that for all cases the numerical simulations follows the same pattern behavior as the analytical one.
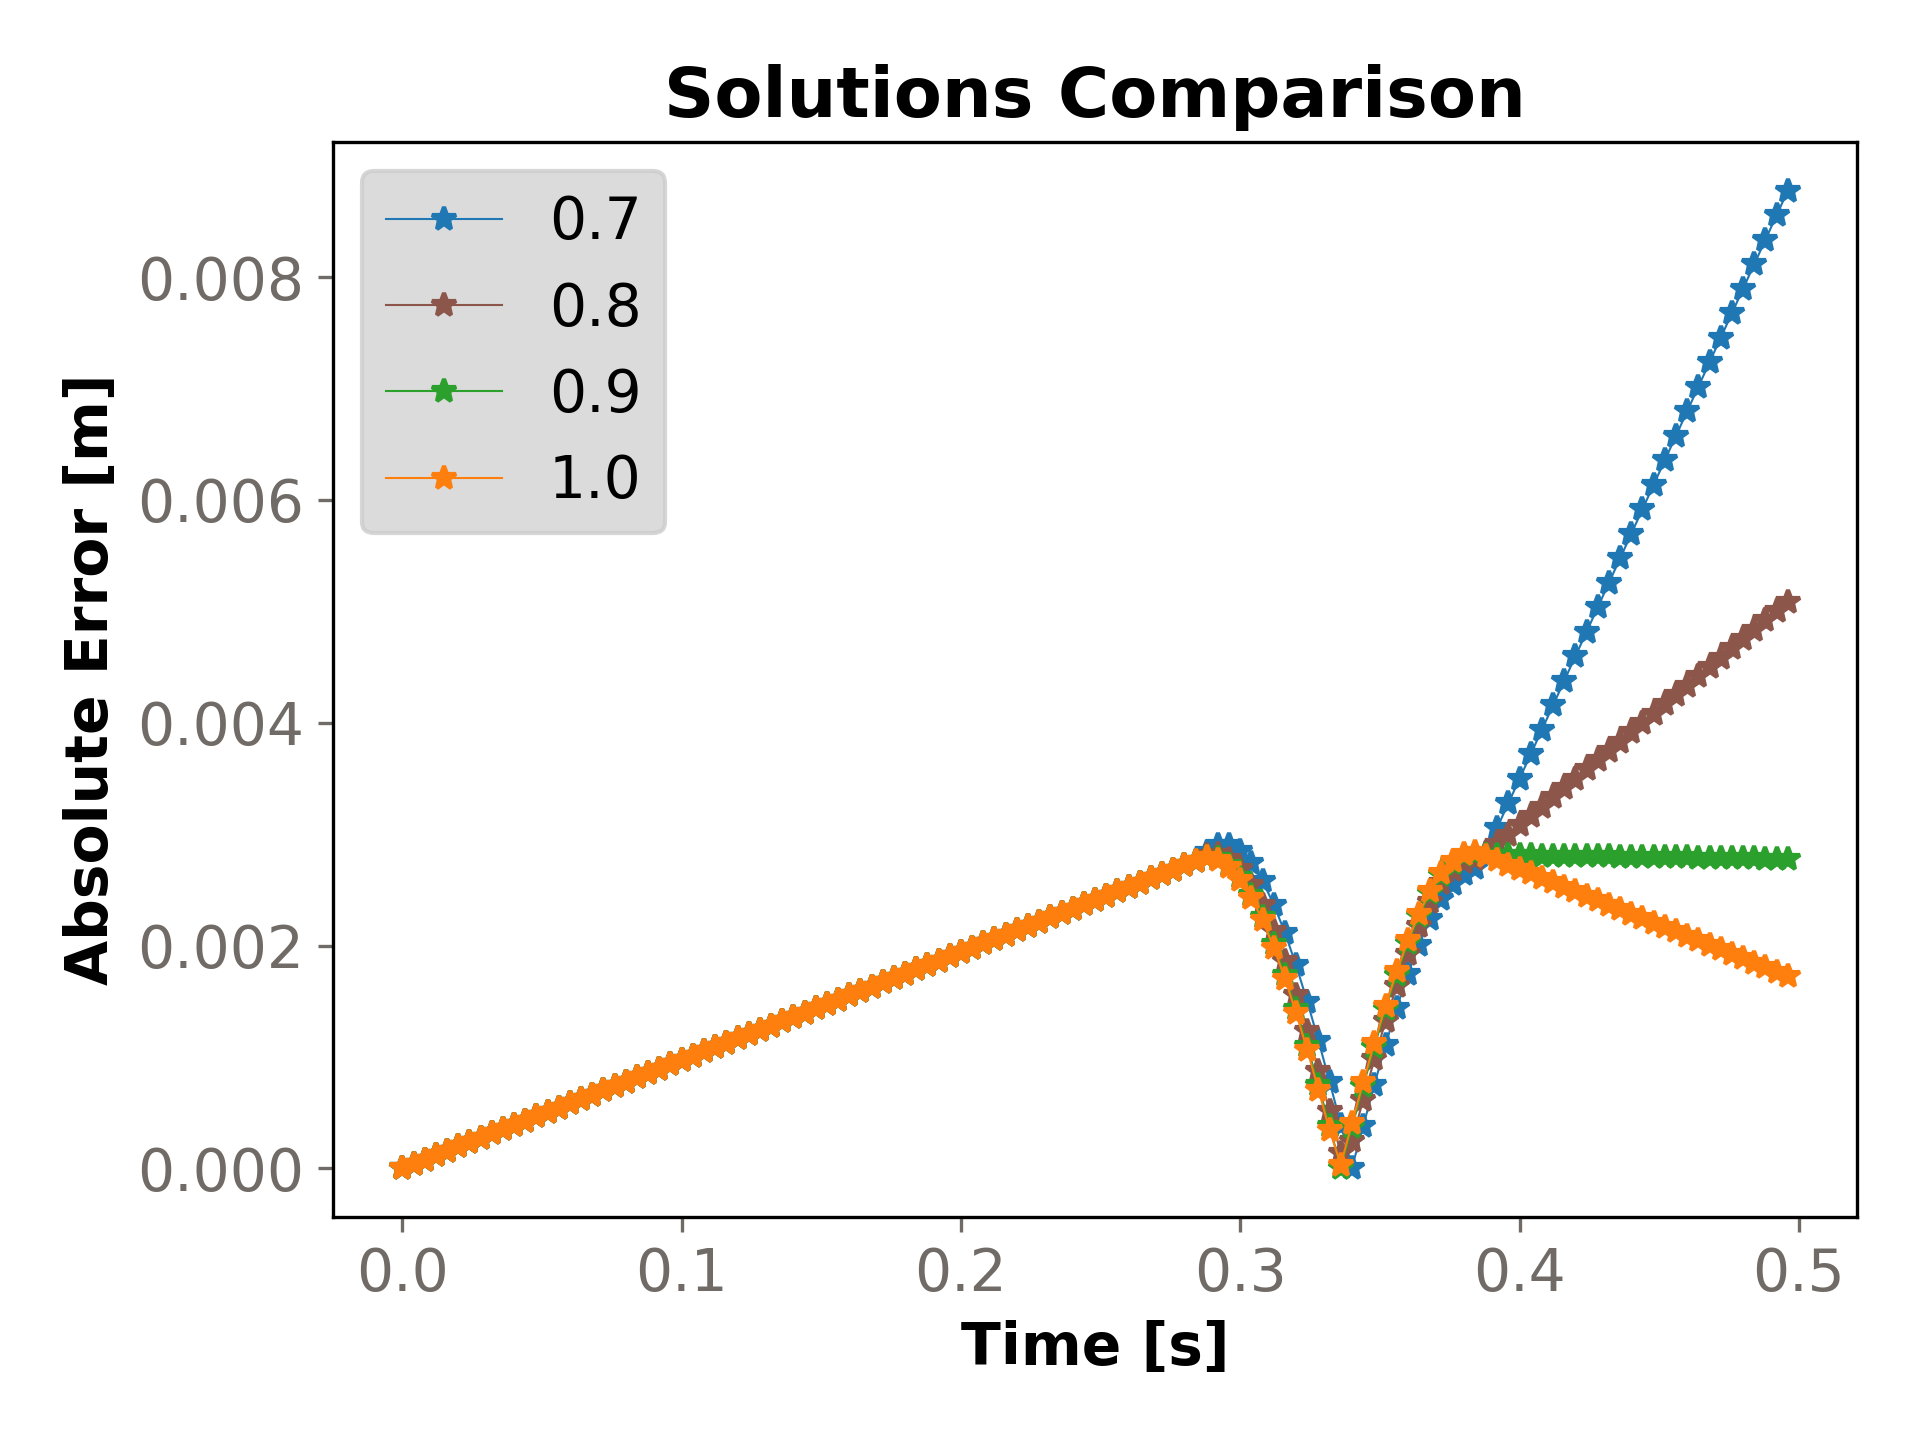
The absolute and relative errors for the sphere's height are compared in Figure 2.18: Absolute error between Rocky and Analytical solution for the height of the sphere. and Figure 2.19: Relative error between Rocky and Analytical solution for the height of the sphere., respectively. It can be seen that the absolute error increases with the decrease of the coefficient of restitution, which follows the conclusions from the previous figure, and the maximum Absolute Error is for the coefficient of restitution equal to 0.7 for the last output, of about 0.0085 m. For the Relative Error, it can be seen that values lower than 4% can be found for all coefficients of restitution for the majority of the simulation. However, when the contact between particle and plate occurs (from around 0.3 to 0.4 s), the Relative Error gets to about 8% for the highest coefficient of restitution. This occurs because even though the Absolute Errors get closer to zero, the height itself gets closer to zero, which means that even the slightest changes in height between analytical and numerical solutions will be higher when evaluating relative values. Also, this occurs for the higher coefficient of restitution due to the lack of energy dissipation during the contact.
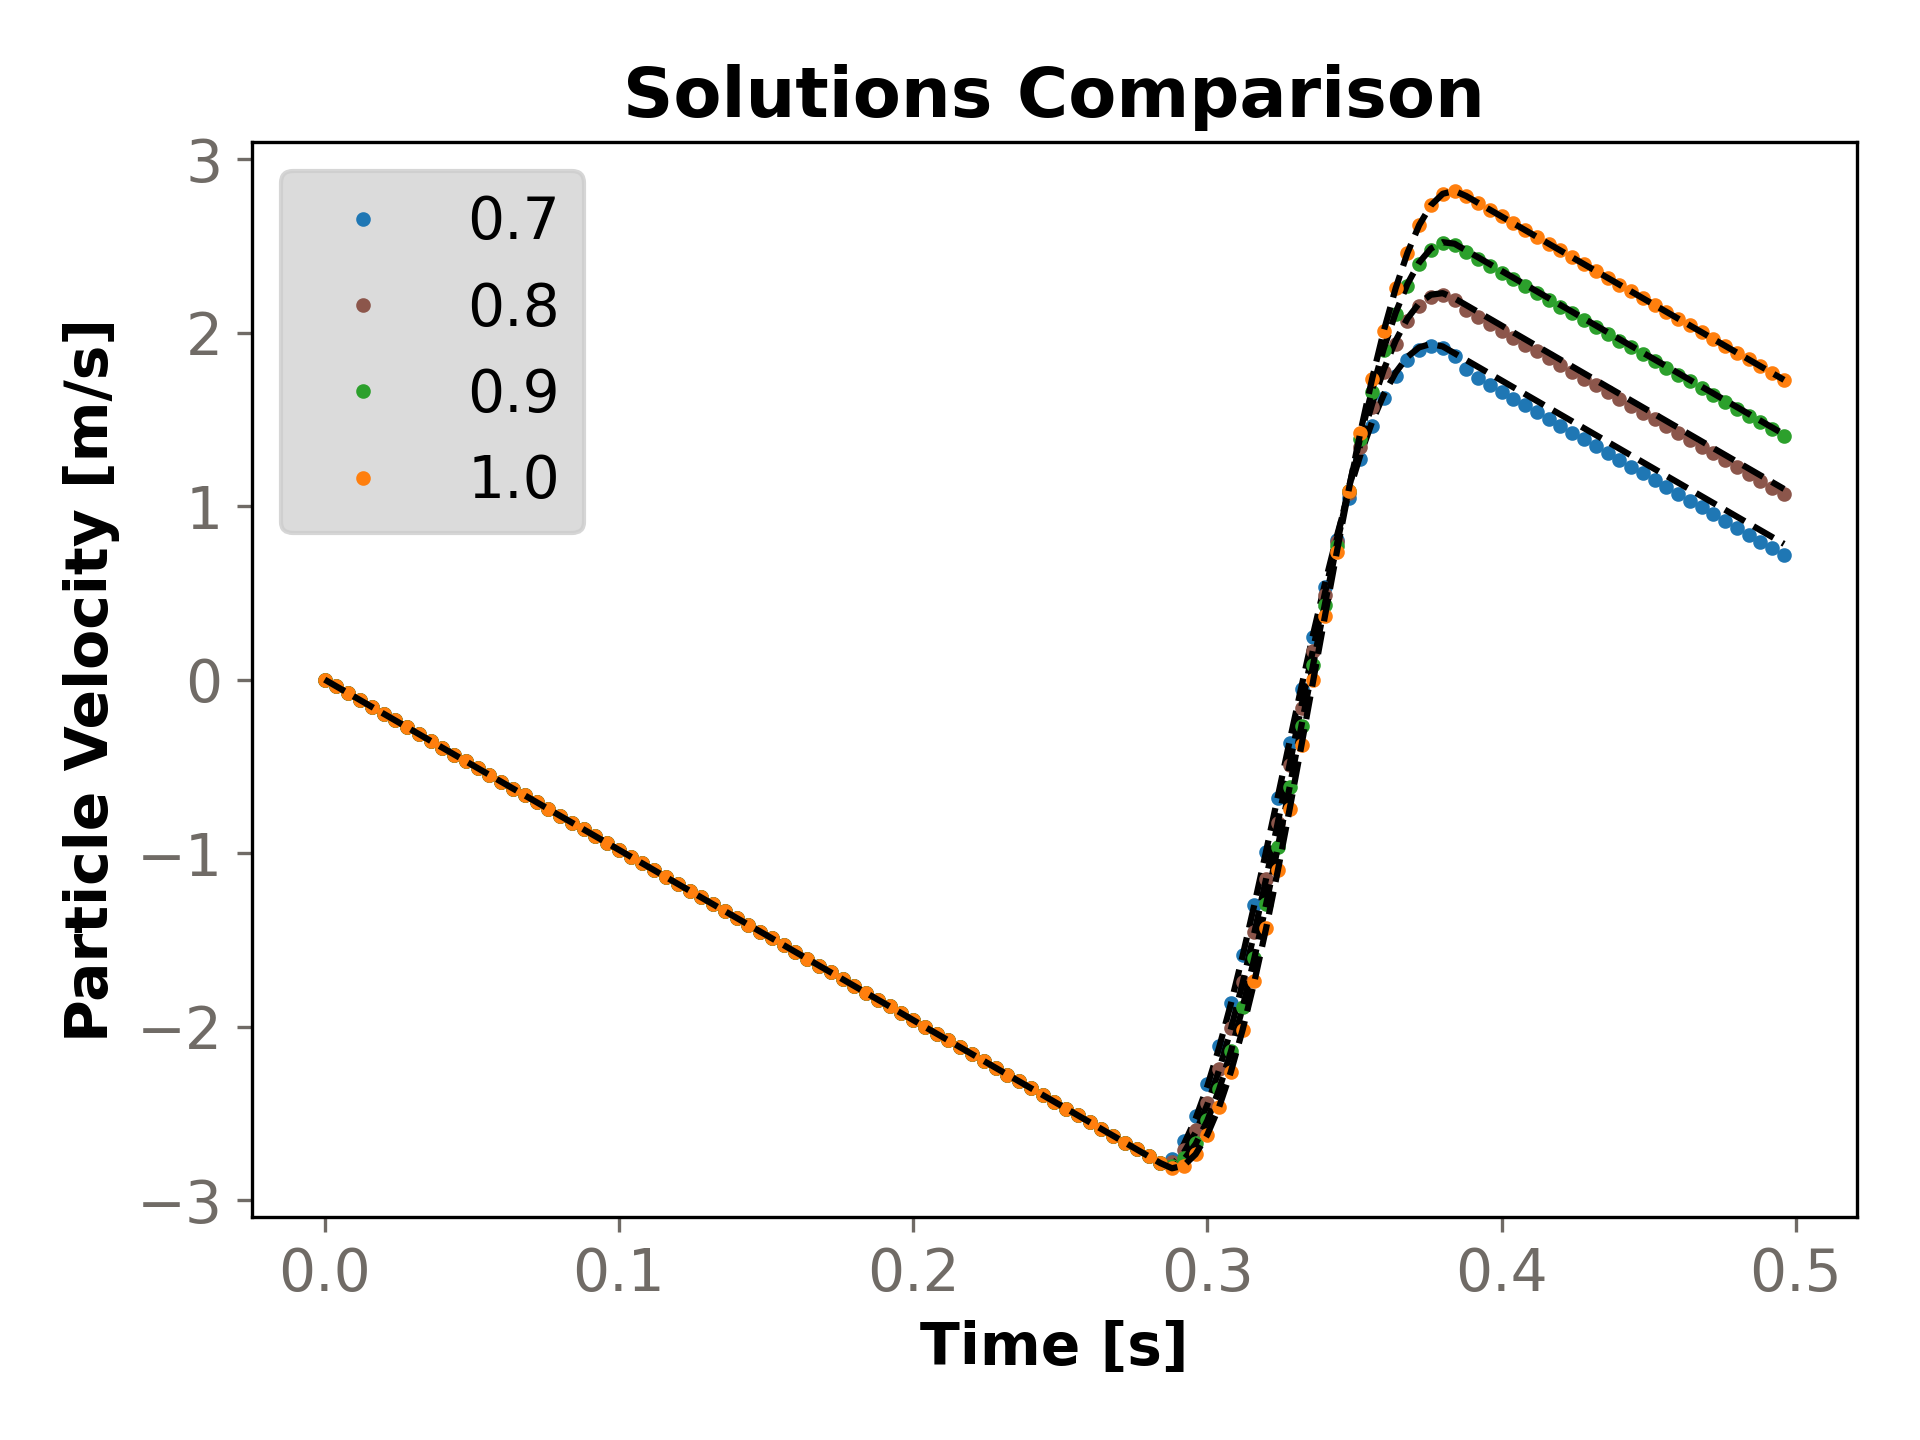
The evolution of the particle's velocity is shown in Figure 2.20: Evolution of the velocity of the sphere for the first bounce. for different coefficients of restitution, labeled from 0.7 to 1.0. This figure presents the analytical results in the dots, and the numerical results from Rocky as dashed lines. It can be seen that the higher the restitution coefficient, the better the correlation between numerical and analytical results.
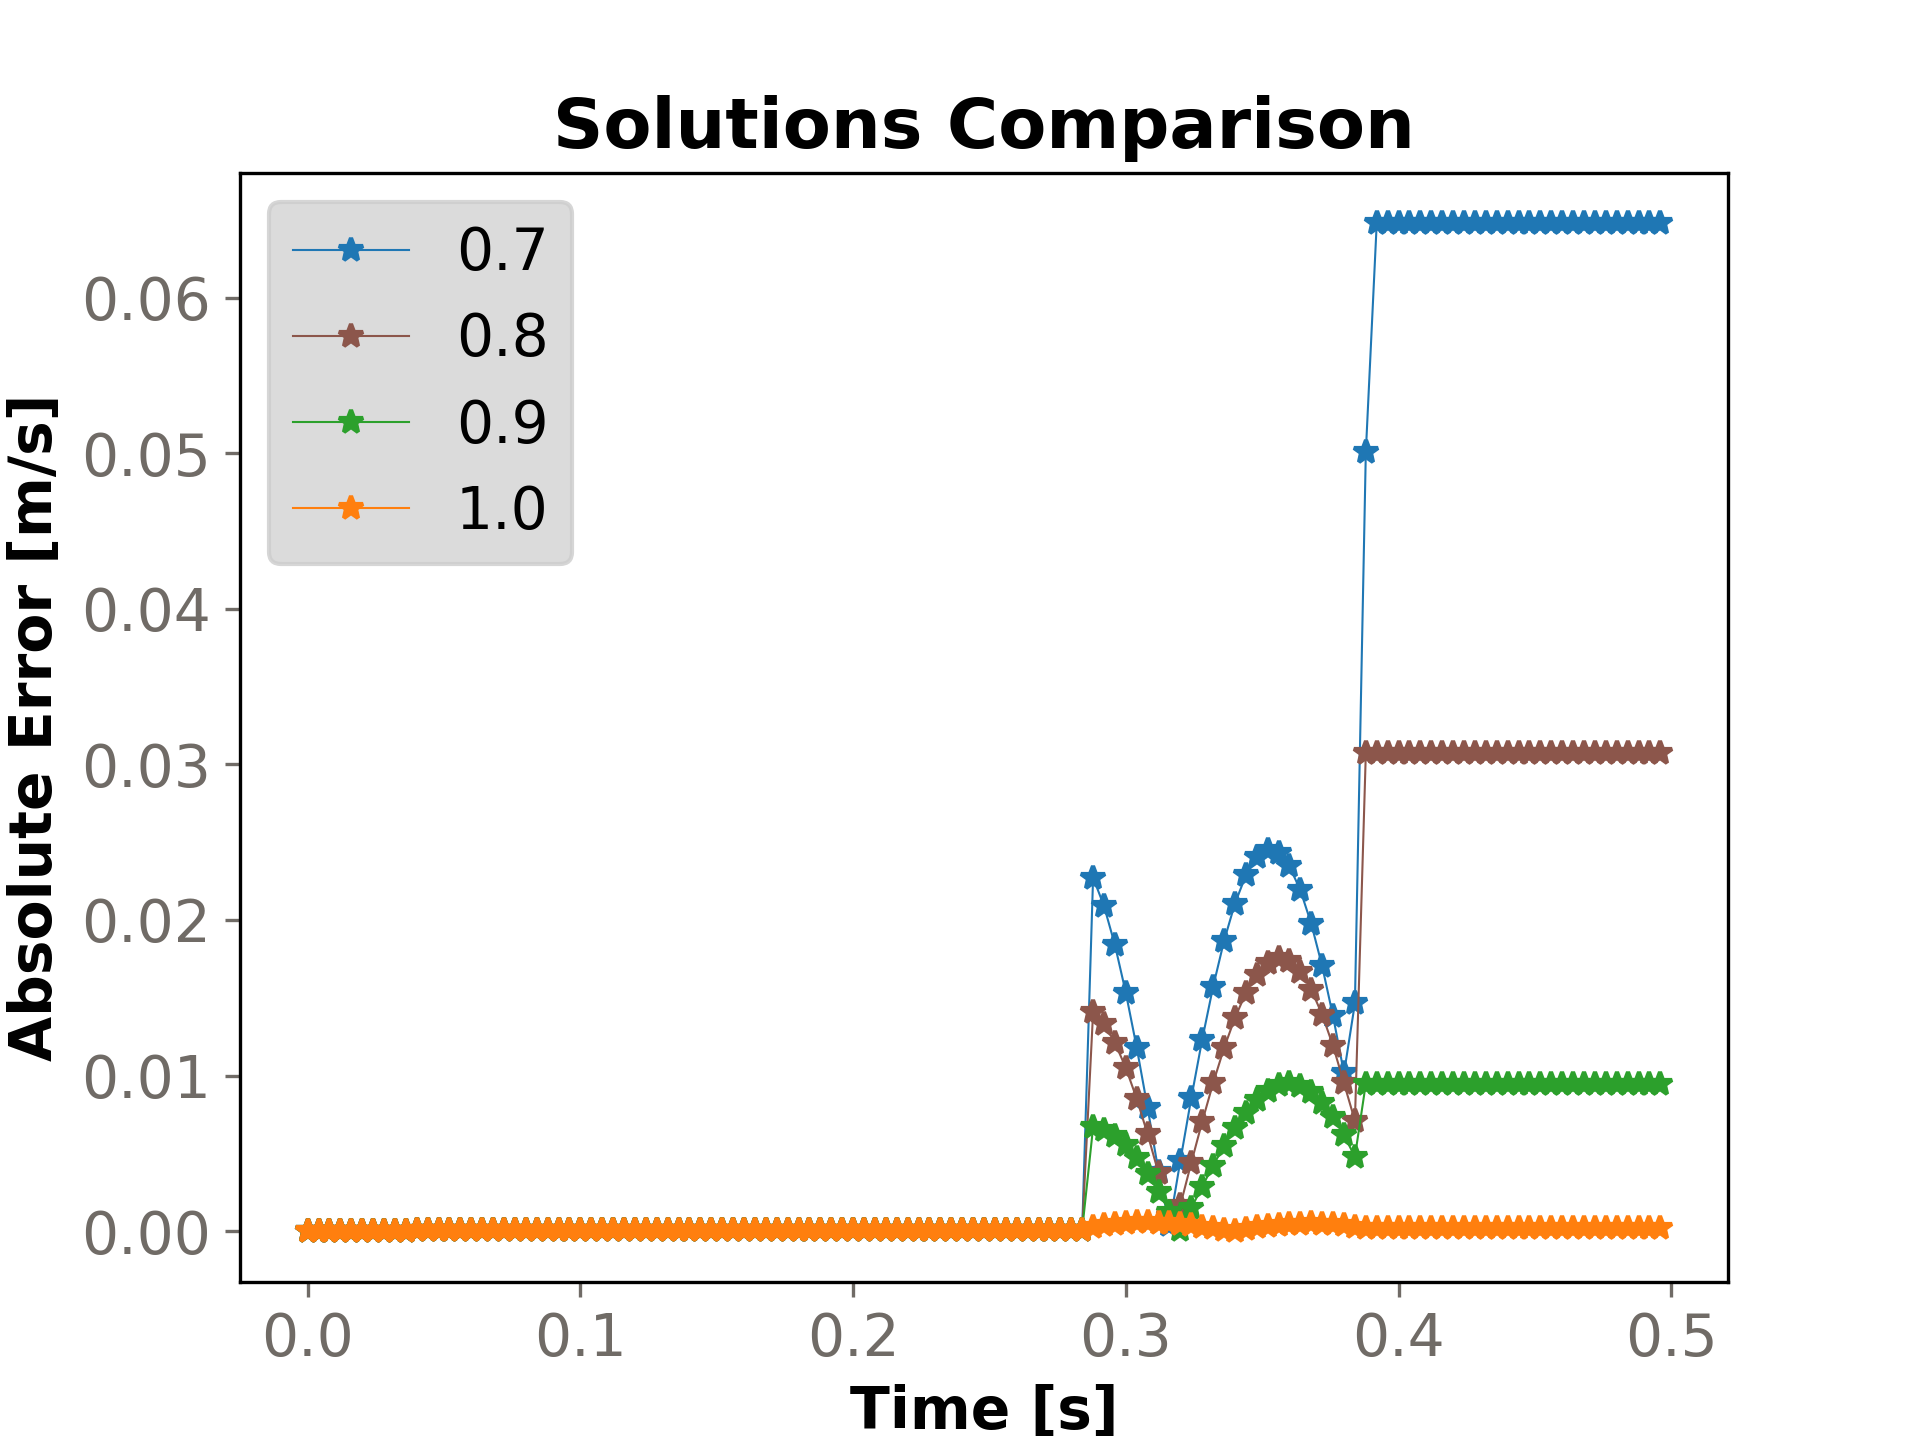
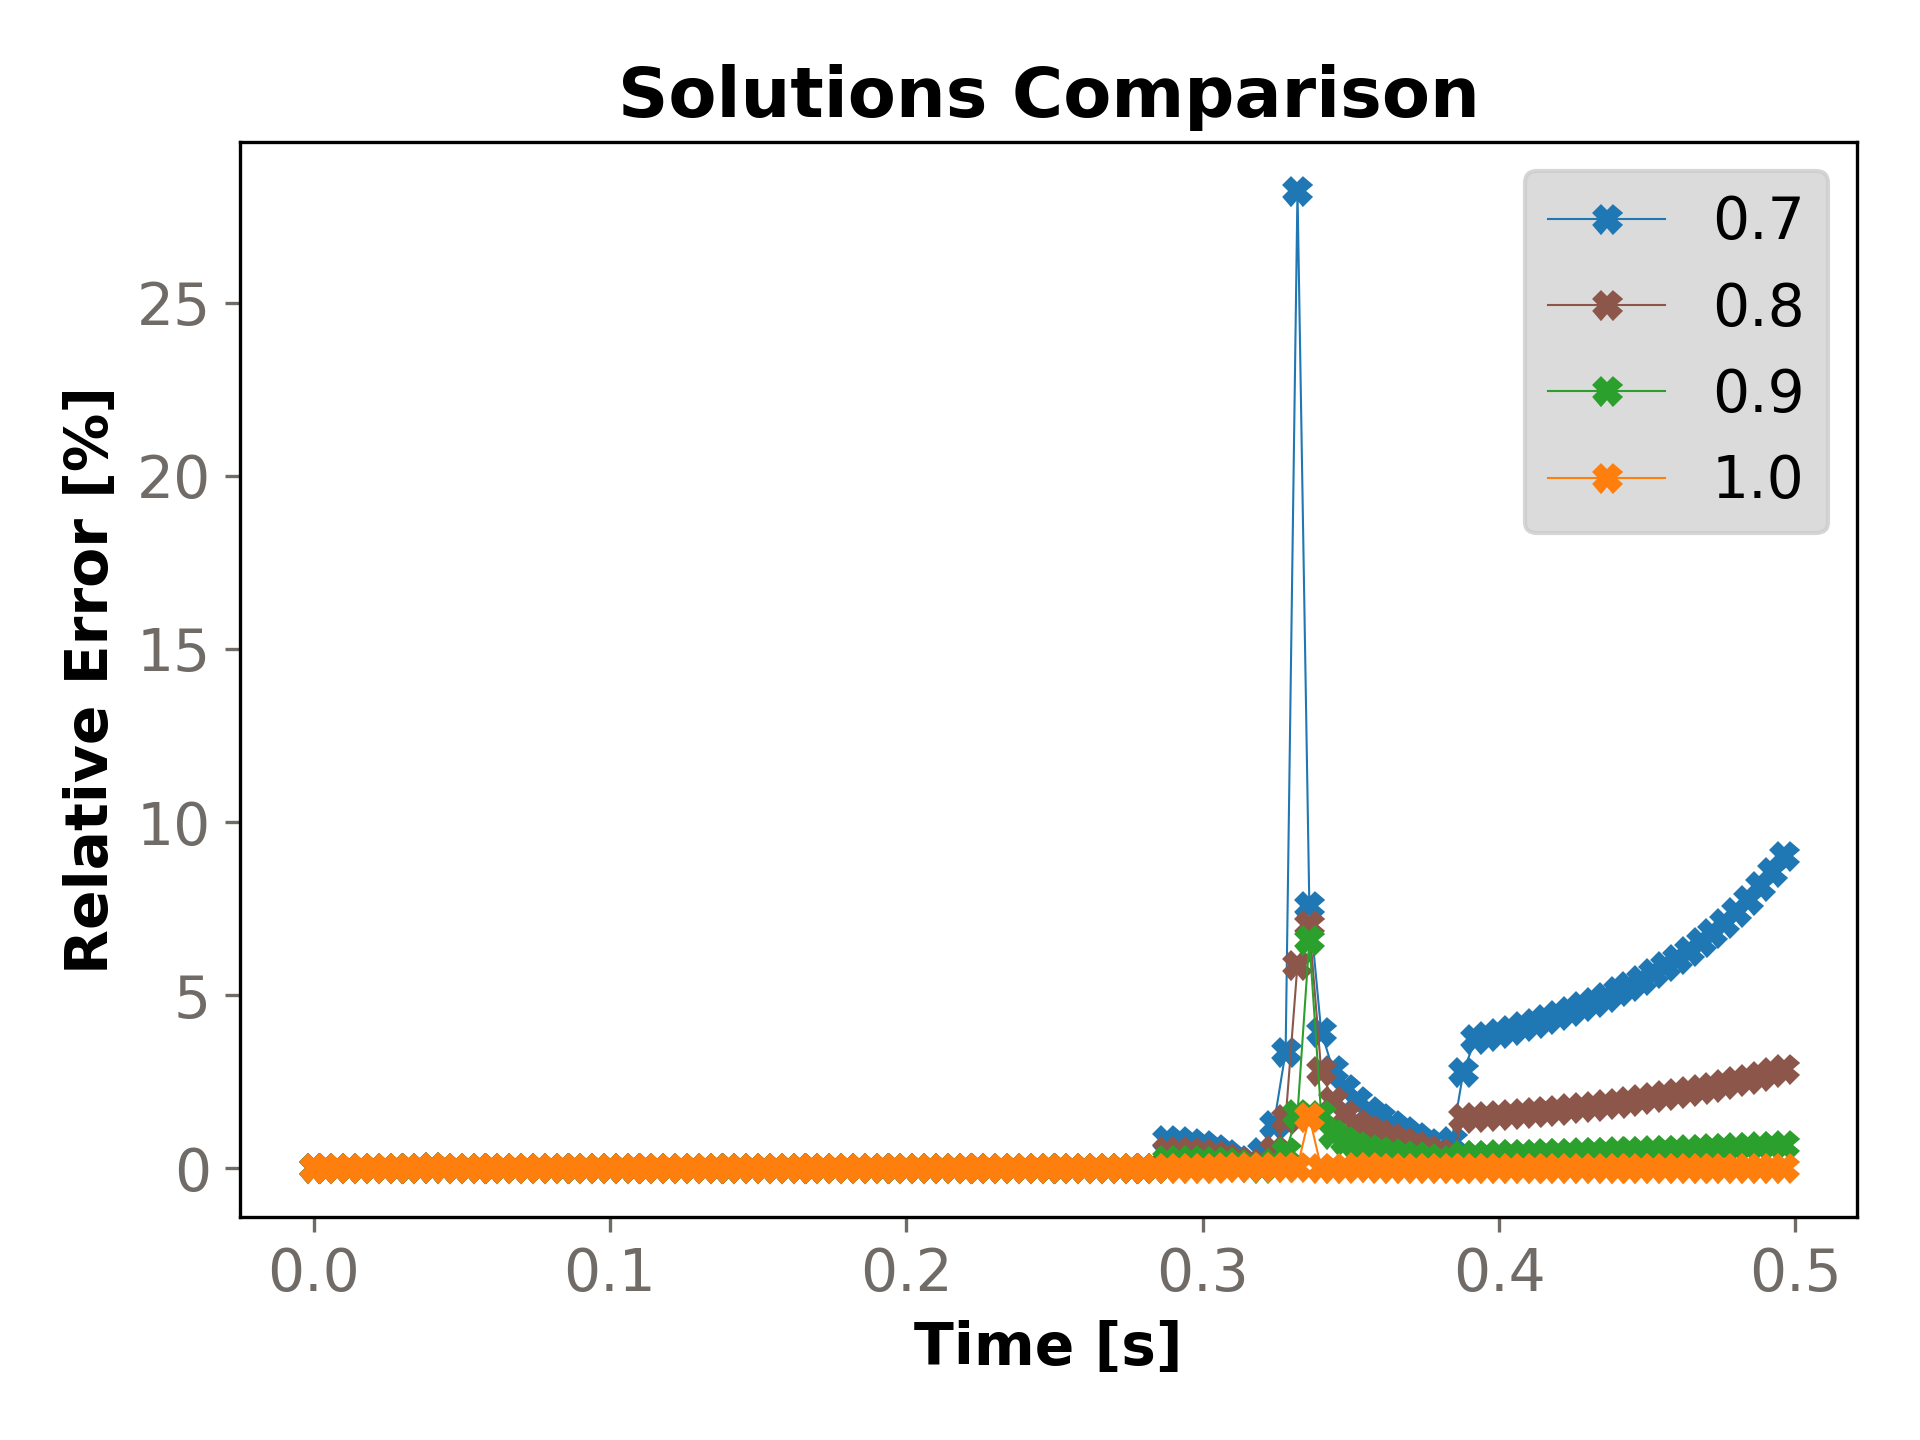
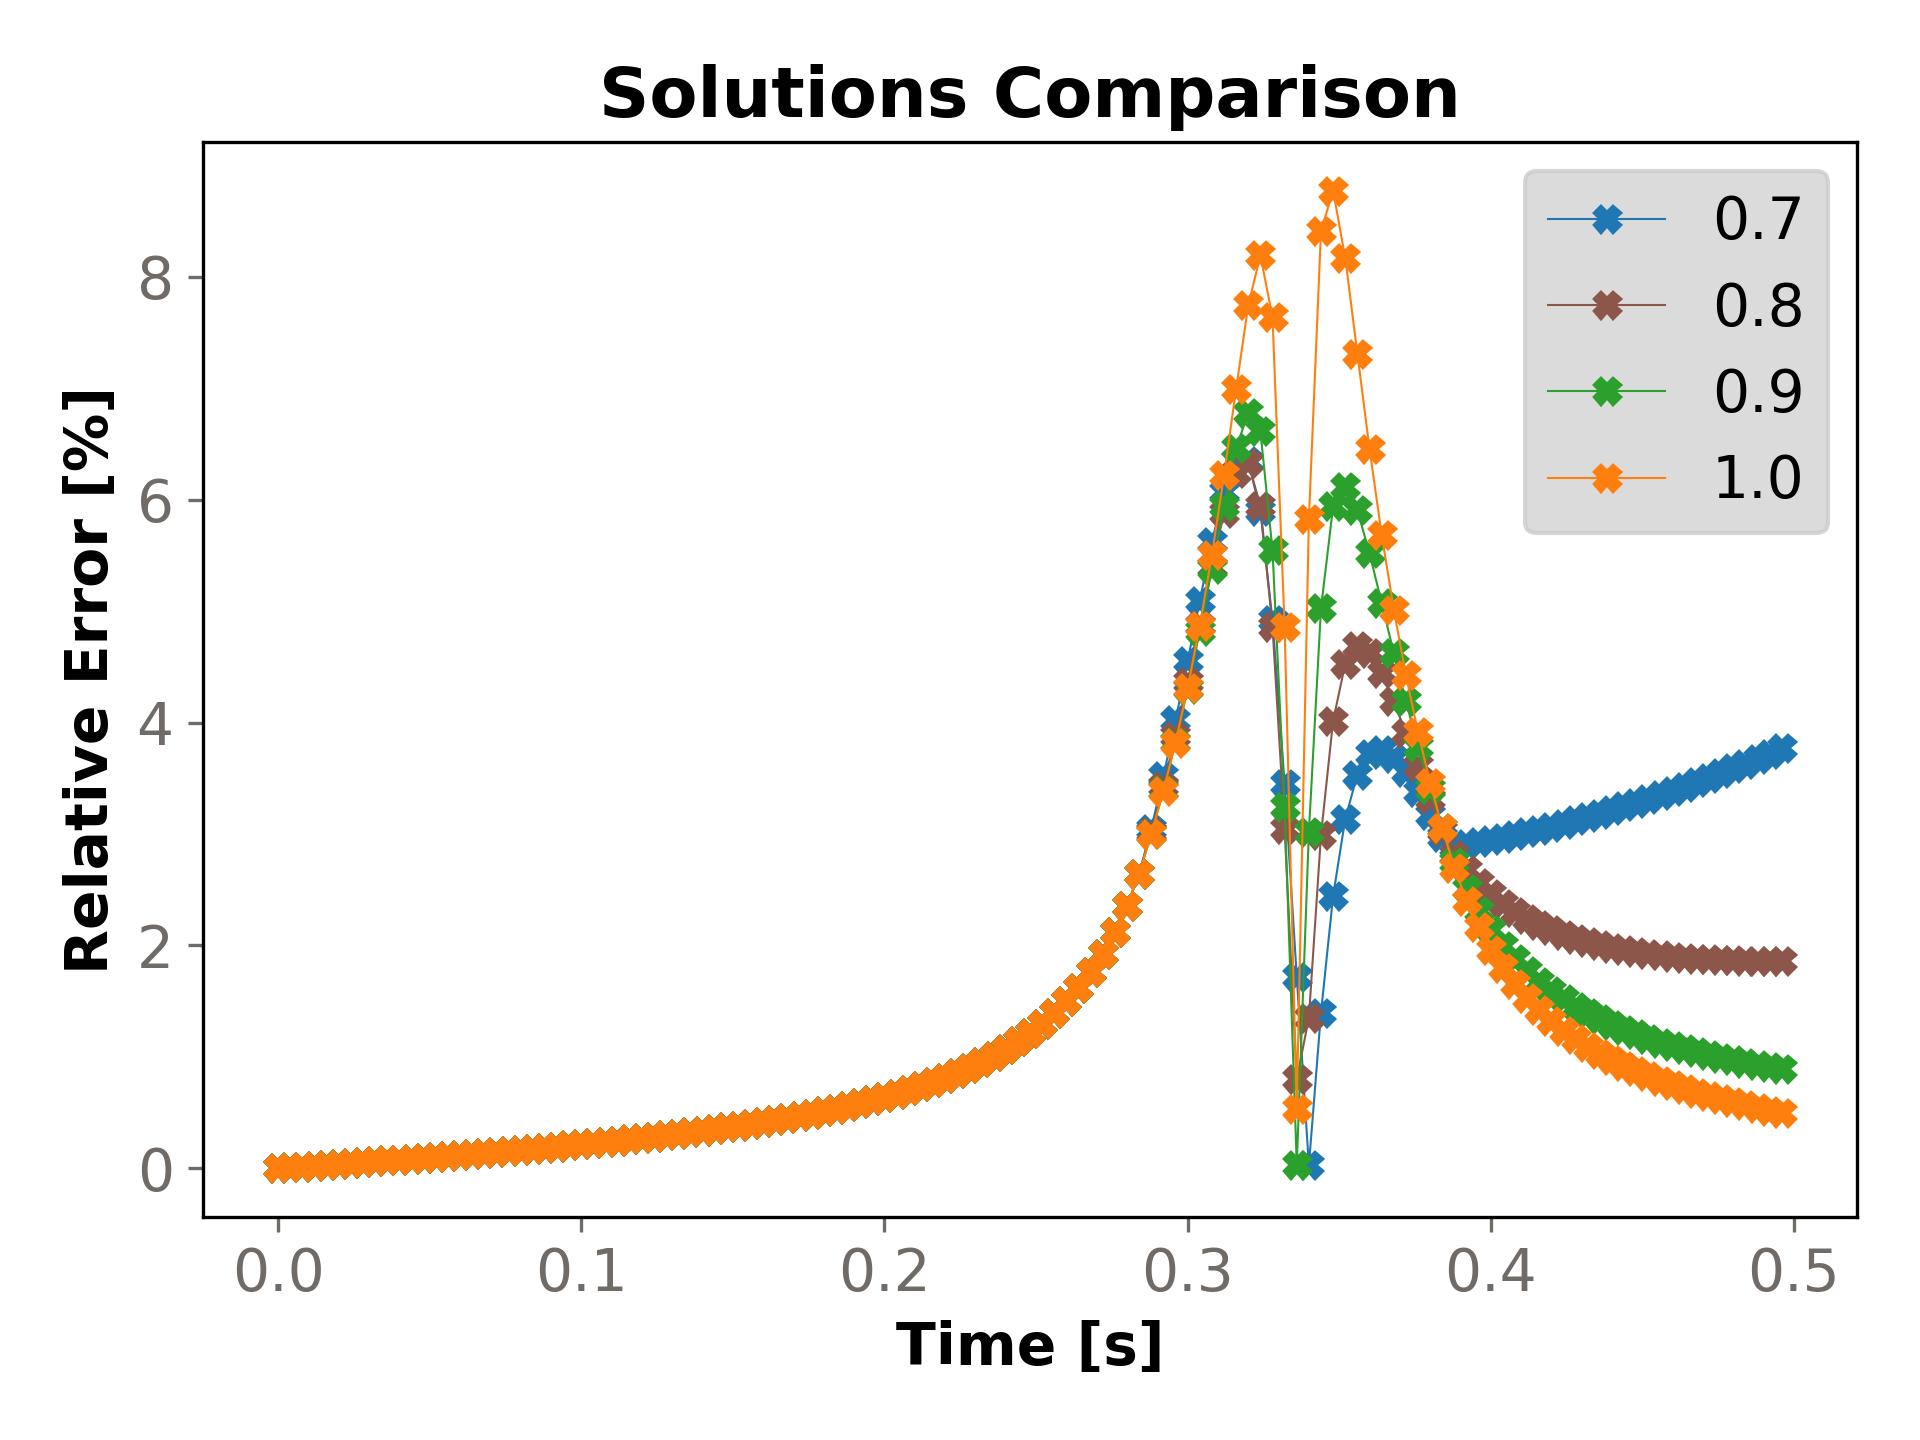
The evolution of the sphere's velocity absolute and relative errors calculated analytically and with Rocky can be verified in Figure 2.21: Absolute error between Rocky and Analytical solution for the velocity of the sphere. and Figure 2.22: Relative error between Rocky and Analytical solution for the velocity of the sphere., respectively. It can be seen that, like in the particle's height, the Absolute Error increases with the decrease of the coefficient of restitution, which follows the conclusions from the previous figure, and the maximum Absolute Error is for the coefficient of restitution equal to 0.7 after the sphere leaves contact with the plate, of about 0.065 m/s. For the Relative Error, it can be seen that values lower than 10% can be found for all coefficients of restitution for the majority of the simulation. However, when the contact between particle and plate occurs (from around 0.3 to 0.4 s), the Relative Error can get as high as 25% for the lowest coefficient of restitution. This occurs because in this range of time the particle is changing its path along the Y-axis from moving towards -Y into moving towards +Y directions, and the velocity reaches values around zero, so that any changes imply on significative Relative Errors.