Energy spectra is another analysis tool present in Rocky, which provides a very detailed view of how the energy is transferred between particles in a simulation. In energy spectra plots, the collision data collected during a simulation is classified based on the energy levels of the individual collisions and then displayed accordingly.
Perhaps one of the most important applications of energy spectra is the prediction of how much of the power consumed in a comminution process actually promotes particle fragmentation. Energy spectra plots can assist users in that analysis without the computational cost of simulating processes involving an actual breakage model.
Three types of energy associated to collisions are considered in energy spectra plots. These energy types are the same already considered in the inter-group collision statistics modules described in section Inter-group collision statistics:
Dissipated energy. The fraction of the mechanical energy of the particle or particles transformed irreversibly into other forms of energy during a collision.
Impact energy. The maximum energy transferred during a collision, considered in the instantaneous breakage models to quantify the damage of the particles' material.
Shear energy. The work done by the tangential contact forces during a collision, used in the abrasive wear model of boundary surfaces.
These energies have correspondence with the works defined previously in section Works. In fact, for a given collision, the numerical value of each one of these energies is equal to the corresponding work defined there. Therefore, for a detailed description of the way the works are calculated in Rocky, please refer to that section.
Rocky comes by default with two energy spectra modules. In the first one, contacts energy spectra, the energy values are collected collision-wise during the simulation and categorized by particle group pair. Conversely, in particles energy spectra the energy values are always related to particles, which are classified by size and particle group. The following two sections detail the specifics of these two energy spectra types.
Each one of the energy spectra plots generated by this module involves one of the
energy types mentioned earlier, herein written in a generic way as . That energy is represented in the horizontal axis of the plot, whereas a
related physical magnitude per unit time,
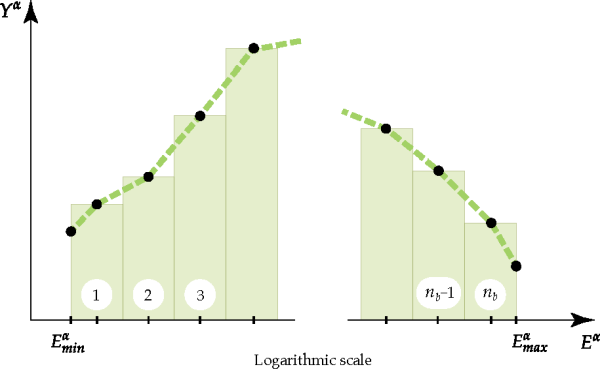
, is represented in the vertical axis, as depicted in Figure 4.6: Schematics of a typical contact-based energy spectra plot. The two extra points
located at the extremities of the interval
include data from collisions whose energies fall outside that
interval.. In all of the
equations below,
is used to indicate one of the three energy types considered in energy
spectra, namely, impact, shear, and dissipated energy.
Figure 4.6: Schematics of a typical contact-based energy spectra plot. The two extra points
located at the extremities of the interval include data from collisions whose energies fall outside that
interval.

The contacts energy spectra module follows the same approach considered in the inter-group collision statistics module to classify collision energy data. Therefore, an individual contact-based energy spectra curve will be generated potentially for each pair of particle groups present in a simulation. And similarly for every particle-group-boundary pair.
In order to construct an energy spectra plot, Rocky divides the horizontal axis into a
certain number of bins or buckets of equal length
when represented in a logarithmic scale. The range of values in the horizontal axis is
determined by and
, which are user inputs listed Minimum Energy as and
Maximum Energy in the Rocky UI. Moreover, the number of bins into
which the interval
is divided is determined by
, a parameter which is listed as Number of Bins in the
Rocky UI. The position of the division points between bins along the horizontal axis are
determined by the expression:
(4–40) |
As mentioned earlier, the main purpose of an energy spectra plot is to provide insight
into the distribution of the energies of all collisions that occurred in a simulation up to
a given time. As depicted in Figure 4.6: Schematics of a typical contact-based energy spectra plot. The two extra points
located at the extremities of the interval include data from collisions whose energies fall outside that
interval., to each one of the bins
defined above will correspond a point in the graph. The horizontal coordinate of the point
associated to the bin i will be given by
. The vertical coordinate will come from the sum of energies or other
associated data from all collisions
which had an energy value
during the time interval associated to the energy spectra plot. It is
possible that energy values of some collisions can fall outside of the plot range
during a simulation. Data of those collisions is still collected and
associated to the extra plot points located at the extremities of the energy interval. More
specifically, if
for a collision, its data is attributed to the point with
as horizontal coordinate, whereas if
, its data goes to the point
.
In plots which have the power represented in the vertical axis, the vertical coordinate of each point in
a graph is calculated as:
(4–41) |
where is the output time to which the plot corresponds, whereas
is the time at which the energy data began to be registered. The value of
can be specified in the Rocky UI through Start Time.
Another parameter that controls when the energy data begins to be collected is
Time Delay After Release. Data of any collision occurring to a
particle is ignored after its entrance into the simulation, during a time lapse equal to the
value of that parameter. The sum in Equation 4–41 comprehends all
collisions that fulfill the time constraint cited above and involves particles that belong
to a given pair of particle groups or a pair particle-group-boundary. As mentioned before,
each curve in a contact-based energy spectra plot is always related to one of such pairs.
Another group of plots generated is related to the energy registration rate. In that case, the vertical coordinates of each point of those plots is given by:
(4–42) |
where gives the number of registration events of energies whose values fall into
a given bin, during the time period in which the collection of energy data is allowed. Here
it is important to note that different energy types can be registered at different times
during a collision. For instance, impact energy is always registered at the end of a loading
period. On the other hand, the dissipated energy is registered only when a collision
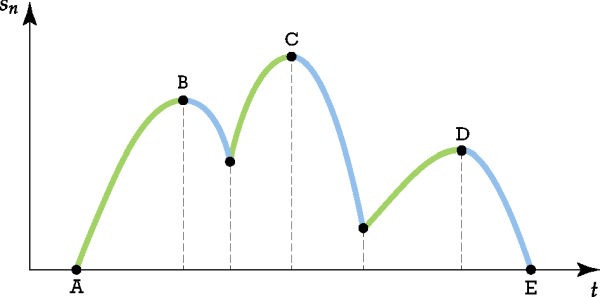
finishes. Because of that, impact can be registered more times than dissipated and shear
energy, since some collisions can present multiple loading-unloading periods. For instance,
in the example depicted in , the impact energy will be registered at points B, C, and D,
while the dissipated and shear energies will be registered only at point E.
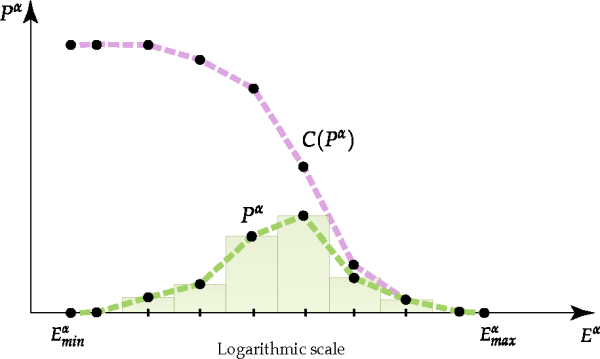
Cumulative power is a third category of plots generated by the contacts energy spectra module. A cumulative power curve is generated from the power values given by Equation 4–41, as showed schematically in Figure 4.8: Example of a cumulative power curve (in purple) generated from a power distribution curve (in green). . The vertical coordinate of each point in a cumulative power curve is given by:
(4–43) |
That is, the vertical coordinate of a cumulative power point results from the sum of the vertical coordinates of all points in the power curve located to the right, up to the given point.
Figure 4.8: Example of a cumulative power curve (in purple) generated from a power distribution curve (in green).

Particles energy spectra curves are cumulative power curves similar to the ones described in the previous section, but constructed considering collision energy values tracked and classified through particles instead of contacts. In a collision, only a fraction of a collision energy is attributable to the deformation of a colliding particle. Therefore, the distribution of energy values per particles might provide an alternative perspective to the one given by contact-based energy spectra curves. Additionally, when a particle size distribution is defined for a particle group, particle-based energy spectra curves are categorized according to prescribed particle size ranges.
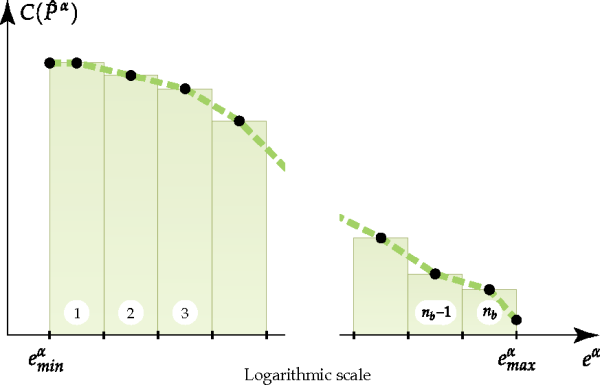
shows a typical energy spectra plot based on particle energy values. Specific energy values are represented in the horizontal axis, whereas cumulative specific power values are represented in the vertical axis. For a given particle p, the specific energy is defined as:
(4–44) |
where is the particle's mass, and
is the energy per particle in a single registration event. As previously
stated,
is used to indicate one of the three types of energy considered in energy
spectra plots: impact, shear, or dissipated.
If at some point a particle is colliding simultaneously with several other particles, will be the sum of the fractions related to the particle
p of the energies on all those collisions. That is:
(4–45) |
where is the fraction of the the collision energy that is attributable to the
particle p. The splitting of the collision energy between two colliding
particles or between a particle and a boundary is made using the splitting factor defined in
, following exactly the same process described in section Boundary collision statistics.
The range in the horizontal axis and its subdivision in bins is determined by , and nb.
These parameters are listed in the UI as Minimum Specific Energy,
Maximum Specific Energy, and Number of Bins,
respectively. The subdivision of the horizontal axis is identical to one described for
contacts energy spectra, the only difference is that it is made in terms of specific energy
rather than energy. Two extra points are considered also at the extremities for taking
account of collision specific energies outside the interval
.
The vertical coordinate of a point in a particles energy spectra plot is the cumulative specific power associated to an energy level, which is given by:
(4–46) |
where the specific power for each bin is determined as:
(4–47) |
The sum in the numerator of this last equation includes all particles energy
registrations for which the corresponding specific energy falls into the interval
associated to the bin i. Additionally, that sum
includes only energies from particles of size
in the size range s, defined here as
. In a similar way, the sum in the denominator only includes particles in
that size range. Finally,
in that expression is the time lapse in which energies from particle
p are allowed to be registered. This time lapse is given by:
(4–48) |
where is the output time to which the plot corresponds, while
is the time when energy data begins to be registered. On the other hand,
is the lapse of time after the release of particle p
in which energy data must be ignored for the construction of the energy spectra curves. The
values of these last two parameters can be specified in the Rocky UI through the module
parameters listed as Start Time and Time Delay After
Release, respectively.


