


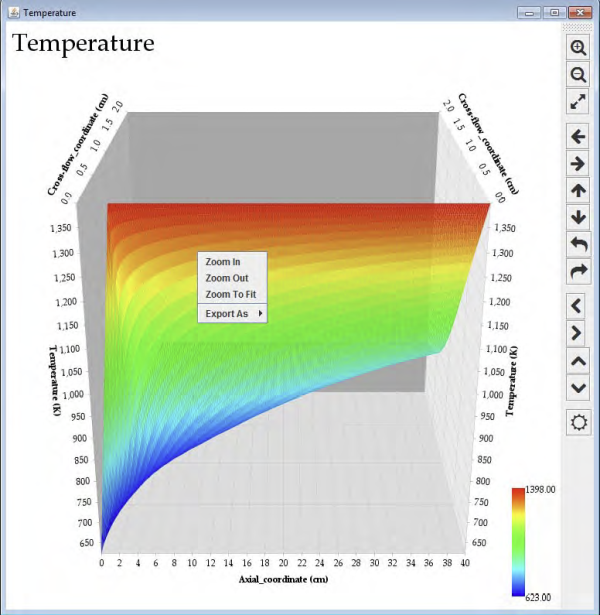
From top-to-bottom as displayed in Figure 2.16: Contour Plot—Context menu displayed, the tool bar options are broken into 4 groups. All of the tool bar buttons have mouse-over tool tips. The first 3 buttons provide the same Zoom In, Zoom Out, Zoom to Fit operations as the context menu.
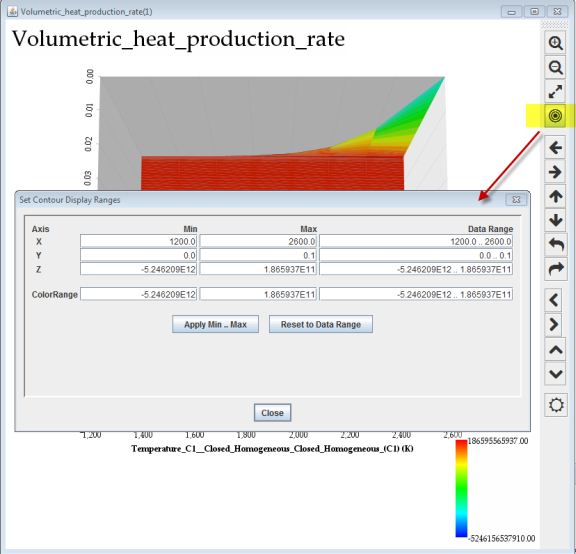
The fourth button, as highlighted in Figure 2.17: Contour Plot—Set Contour Display Ranges, opens a dialog to adjust the X, Y, Z, ranges displayed and the bounds of the color scale associated with the Z values.
The next group of 6 buttons control the rotation of the 3-D image in the 3 dimensions. These operations are also performed with the mouse by clicking and holding the left mouse button while moving the mouse.
The next 4 buttons control the translation of the 3-D image in the X and Y directions. You can also perform these operations by clicking the left mouse button and moving the mouse—while holding down the Alt key.
The bottom button gives you access to control the light source used to light the contour. There is only one light source; multiple light sources are not currently supported.