


As was mentioned in the previous sections, when running with the Redlich Kwong equation of state or a user supplied .rgp file, the flow solver clips two dimensional property tables at the spinodal or saturation curves. For any other definition of properties, no clipping is performed.
Because all properties stored inside the flow solver are in terms of pressure and temperature, the clipping process can be understood by analyzing it on a pressure-temperature diagram, which separates the liquid and vapor regions. The two dimensional tables typically span a given temperature and pressure range and are resolved with a number of points in both directions. Figure 12.5: Typical Pressure-Temperature Diagram shows a rectangular region where the pressure and temperature range span across the critical point.
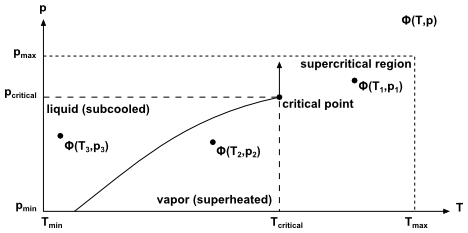
Below the critical point, the liquid and vapor regions are separated by the saturation
curve and above the critical point, say for  , there is no difference between the liquid and vapor states.
One problem with evaluating liquid properties is that not all equations of state
accurately predict properties in the subcooled liquid region where
 . When using the Redlich
Kwong equation of state the flow solver generates vapor property tables that cover the
entire pressure and temperature range except for the subcooled liquid region below the
critical pressure and temperature. In the vapor region below the critical temperature,
the flow solver will automatically clip vapor properties along the spinodal curve or
saturation curve as necessary.
. When using the Redlich
Kwong equation of state the flow solver generates vapor property tables that cover the
entire pressure and temperature range except for the subcooled liquid region below the
critical pressure and temperature. In the vapor region below the critical temperature,
the flow solver will automatically clip vapor properties along the spinodal curve or
saturation curve as necessary.
When using an .rgp file, the one-dimensional saturation tables
that are used for clipping the two-dimensional tables must be properly filled in with
saturation or spinodal data as required by the model being run. So, for example, if you
want to run the equilibrium phase change model, then the vapor values of
 for
for  and
and  for
for  must be supplied. If you
generate your own .rgp files, you should always generate the
saturation table data in this manner.
must be supplied. If you
generate your own .rgp files, you should always generate the
saturation table data in this manner.