


CFD-Post automatically makes available a report of the output of your simulation. You can control the contents of the report in the Outline workspace, see the available sections of the report in the Report Viewer, add new sections in the Comment Viewer, and publish the report in HTML or in plain text form.
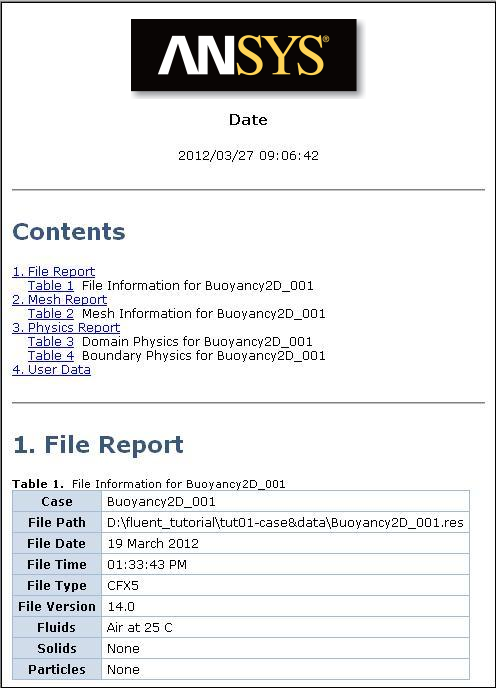
Here is an example of a report that uses the generic template; if you have a RES file loaded in CFD-Post, you can see a similar report by clicking on the Report Viewer tab at the bottom of the Viewer area.
Note: The sample report shown in Figure 3.2: A Sample Report, Part 1, Figure 3.3: A Sample Report, Part 2, and Figure 3.4: A Sample Report, Part 3 is taken from
a Report.html file, much like the one that you
generate when you click the Publish button  .
.
A report is defined by the Report object
and the objects stored under it. The Report object,
like other objects, can be saved to, and restored from, a state file.
For details, see File Types Used and Produced by CFD-Post. Only one Report object exists in a CFD-Post session.
You can remove major sections of the report by expanding the Report section in the Outline tree view and clearing the check box beside the section to be omitted. To see the results of such operations, right-click Report and select Refresh Preview.
Note: The Title Page option controls the inclusion of the logo, title, dates, and Table of Contents sections.
To change a default section, right-click the section name in the Outline tree view and click .
For the Title Page, you can:
Add a new logo (JPG or PNG only)
Remove the Ansys logo
Change the report’s title
Add the author’s name
Control the display of the date and the table of contents.
After making changes, click and Refresh Preview to see the results in the Report Viewer.
The other report pages control detailed information about the mesh, physics, and solution. Again, after making changes, click and Refresh Preview to see the results in the Report Viewer.
You can add new sections by using the Comment Viewer (at the bottom of the viewer pane):
In the Comment Viewer toolbar, click New Comment
 to ready the Comment
Viewer for editing.
to ready the Comment
Viewer for editing.Add a title for your new section in the Heading field.
Set the level of the heading in the Level field (use "1" for new sections; "2" for subsections, and so on).
Type your text in the large, white text-entry field (HTML code is not accepted because it is generated automatically).
When your new section is complete, select its name in the Outline tree view under Report, then press Ctrl+Up Arrow (or Ctrl+Down Arrow) to move the new section in the report hierarchy.
To see how the report will look, right-click Report and select Refresh Preview. The updated report appears in the Report Viewer.
To publish the report so that it can be loaded into a third-party browser or editor, right-click Report and select Publish. For details, see Publishing the Report.
To save the report, click . The report is written to the file you specified.
Report templates are available for rapidly setting up application-specific reports. Depending on the information contained in a results file, a report template will be selected automatically, and made available as a command in the following places:
The File > Report menu
The shortcut menu that appears when you right-click the
Reportobject.
In the same places, there is a Report Templates command that invokes the Report Templates dialog box. This dialog box allows you to:
Browse the list of existing templates.
Add (register) a template.
To do this:
Click Add template
 on the Report Templates dialog
box to invoke the Template Properties dialog
box.
on the Report Templates dialog
box to invoke the Template Properties dialog
box.Select a state or session file that contains a report; alternatively, you can choose to use the current state of CFD-Post, and provide a filename to which to save the template.
Provide a name and description for the template. You cannot use the name of an existing template.
If you are loading a state or session file, and the filename does not end in
.cstor.cse, set the Execution setting to eitherStateorSession, as applicable.
View and/or edit the properties of a template.
To do this:
Click Edit Properties
 on the Report Templates dialog
box to invoke the Template Properties dialog
box.
on the Report Templates dialog
box to invoke the Template Properties dialog
box.View and/or edit the name, description, and path to the template file, as applicable. You can edit the properties for templates that were added, but not the standard templates.
Delete templates from the set of available templates.
You can delete only the templates that were added. To do this:
Select a user template in the Report Templates dialog box.
Click Delete
 .
.
Postprocessing within CFD-Post is fully automated using the turbomachinery report templates. The turbo reports are designed for single-phase fluid analyses, and can only be used with steady-state cases. The turbo reports can be used for individual bladerows of a multi-bladerow analysis by loading each bladerow domain separately into CFD-Post using the domain selector. (To enable the domain selector, click the Edit > Options menu, select Files and select the Show domain selector before load option.)
Important:
Turbo reports attempt to auto-initialize Turbo mode. However if auto-initialization fails, you must initialize Turbo mode manually and re-run the turbo report.
CFD-Post cannot automatically detect a solution that is "360 Case Without Periodics", so you need to set this manually.
Turbo report templates are not designed for multifile usage or comparison mode. In these cases:
User charts that contain local variables will not have plots showing the differences in comparison mode.
Tables will not show differences in comparison mode.
There will be only one picture of the meridional view of the blades (corresponding to the first loaded results file).
Because transient blade row results are different in each passage, Turbo Reports are not designed for transient blade row cases, and results may not be what is expected. Plots in Turbo reports that appear to show multiple passages actually show copies of the first passage and not expanded passages. In other words, the turbo report tool follows the same behavior as any other solution method; that is, it makes an instanced copy of the first passage and plots the variables there.
These are the variables required for all Release 2024 R2 turbo reports:
CFX Variables Required for all Release 2024 R2 Turbo Reports
Density
Force X
Force Y
Force Z
Pressure
Total Pressure
Total Pressure in Stn Frame
Rotation Velocity
Velocity
Velocity in Stn Frame u
Velocity in Stn Frame v
Velocity in Stn Frame w
Velocity in Stn Frame
Velocity in Stn Frame Flow Angle
Velocity Flow Angle
Velocity in Stn Frame Circumferential
Velocity Circumferential
Velocity Meridional
Note: If all of the turbo components in the results file are 'stationary', then variables having names ending with 'in Stn Frame' are not required.
Fluent Variables Required for all Release 2024 R2 Turbo Reports
Density
Static Pressure
Total Pressure
X Velocity
Y Velocity
Z Velocity
In addition to the variables mentioned above, the following variables are required for compressible flow reports:
CFX Variables Required for all Release 2024 R2 Compressible Flow Turbo Reports
Temperature
Total Temperature
Total Temperature in Stn Frame
Static Enthalpy
Total Enthalpy
Total Enthalpy in Stn Frame
Isentropic Total Enthalpy
Polytropic Total Enthalpy
Total Density in Stn Frame
Total Density
Specific Heat Capacity at Constant Pressure
Specific Heat Capacity at Constant Volume
Rothalpy
Static Entropy
Mach Number
Mach Number in Stn Frame
Isentropic Compression Efficiency
Isentropic Expansion Efficiency
Fluent Variables Required for all Release 2024 R2 Compressible Flow Turbo Reports
Static Temperature
Total Temperature
Enthalpy
Total Enthalpy
Specific Heat (Cp)
Rothalpy
Entropy
Mach Number
When variables are missing, lines in the turbo report tables that depend on these variables will be missing.
Results files from Fluent (and from some other sources) will not have all the turbomachinery data that CFD-Post requires. For turbo results files that lack data about the number of passages, you must do the following:
For Fluent files, prior to loading a turbo report template, create a new variable that the report expects (but which is not available from Fluent files):
From the toolbar, click Variable
 . The Insert Variable dialog
box appears.
. The Insert Variable dialog
box appears.In the Name field, type
Rotation Velocityand click . The details view for Rotation Velocity appears.In the Expression field, type
Radius * abs(omega) / 1 [rad]and click . This expression calculates the angular speed (in units of length per unit time) as a product of the local radius and the rotational speed.
When you load a turbo report for a case that is missing some variables, an error dialog box appears showing warnings and errors. Generally this means that some rows in the turbo report will not appear.
Turbo reports for Fluent files will not display information about absolute Mach number. This causes charts of Mach number to display only the relative Mach number.
For any results file that is missing the number of passages (such as Fluent files and CFX results files not set up using the Turbo Mode in CFX-Pre), after you load the turbo report template, do the following for each domain:
A
<domain_name>Instance Transform appears in the Outline tree view under User Locations and Plots. Prior to viewing the report, double-click this name to edit the instance transform. In the # of Passages field, ensure that the number of passages matches the number of passages in the domain. If you enter a new number, click .On the Expressions tab, double-click the expression
<domain_name>Components in 360 to edit it. Match the definition to the number of components in the domain. If you enter a new number, click .
In the Report Viewer, click to ensure that the contents are updated.
If the model was set up using CFX-Pre Turbo Mode, then CFD-Post will automatically be able to determine which report to load based on the machine type and flow type selected, and will prompt you to load it. The report can also be loaded manually by right-clicking on the Report item in CFD-Post. To avoid conflicts with the current CFD-Post state, you should load the report in a clean session.
In the Computed Results table, any values that are shown as "N/A" mean that the necessary scalar variables for computing these values were missing from the results file. This might happen if the solution was run using an older version of CFX, or if some of the scalar variables were manually disabled.
The report templates are CFD-Post session files located in the CFX install under the etc/PostReports directory. You can edit these reports or make new versions to add to the list of report templates. The following table shows the correspondence between the machine type, the flow type settings, and the report selection.
| Machine Type | Fluid Type | Domain Motion (Single Domains Only) | Report Template |
|---|---|---|---|
| Pump | Any | Rotating | Pump Impeller |
| Stationary | Stator | ||
| Fan | Any | Rotating | Fan |
| Stationary | Stator | ||
| Fan | Any | Rotating | Fan Noise |
| Axial Compressor | Compressible | Rotating | Axial Compressor Rotor |
| Stationary | Stator | ||
| Centrifugal Compressor | Compressible | Rotating | Centrifugal Compressor Rotor |
| Stationary | Stator | ||
| Axial Turbine | Compressible | Rotating | Turbine Rotor |
| Stationary | Turbine Stator | ||
| Radial Turbine | Compressible | Rotating | Turbine Rotor |
| Stationary | Turbine Stator | ||
| Hydraulic Turbine | Incompressible | Rotating | Hydraulic Turbine Rotor |
| Stationary | Stator | ||
| Other | Any | Rotating | Pump Rotor |
| Stationary | Stator |
Several reports support postprocessing results for multiple components/blade rows. These reports attempt to group the components into stages. You can control how the stages are formed by editing the corresponding report session file. The available session files include:
- AxialCompressorReport.cse
Report template for axial compressors
- CentrifugalCompressorReport.cse
Report template for centrifugal compressors
- CompressibleTurbineReport.cse
Report template for compressible flow turbines.
- HydraulicTurbineReport.cse
Report template for incompressible flow turbines.
- PumpReport.cse
Report template for incompressible flow pumps.
| Machine Type | Fluid Type | Report Template |
|---|---|---|
| Pump | Any | Pump |
| Axial Compressor | Compressible | Axial Compressor |
| Centrifugal Compressor | Compressible | Centrifugal Compressor |
| Axial Turbine | Compressible | Turbine |
| Radial Turbine | Compressible | Turbine |
| Hydraulic Turbine | Incompressible | Hydraulic Turbine |
To create or modify a report, do the following:
Specify the settings for the report that are contained in the
Reportobject.For details, see Report Object.
Specify the settings for the title page that are contained in the
Title Pageobject.For details, see Title Page Object.
Decide which predefined tables to use.
For details, see:
Optionally, create objects that give additional content to the report.
For details, see Adding Objects to the Report.
Control which objects get included in the report, and the order in which they are included.
For details, see Controlling the Content in the Report.
Refresh the report.
For details, see Refreshing the Report.
You may refresh the report at any time to see the effect of changes you make to the report settings and content. The report appears in the Report Viewer.
You can publish a report so that it can be loaded into a third-party browser or editor. For details, see Publishing the Report.
The settings on the Appearance tab of the Report object are described next.
Choose the image format in which you want the image files to be saved.
Choose the size for figures that appear in the report. There are preset sizes, and an option for setting a custom size.
If you set Figure Size to Custom, set the figure width and height in pixels.
When this option is selected, each figure is produced with the view centered and the zoom level set automatically.
Choose the image format in which you want the chart files to be saved.
Choose the size for charts that are saved as part of the report. There are options that specify preset sizes, an option for using the same size as figures, and an option for setting a custom size.
The Title Page object is automatically
generated and listed under the Report object.
The settings of this object determine the content of the title page,
and are described next.
The Custom Logo check box determines whether or not a custom logo is included in the title page. The logo must be available in a file of compatible format.
The Ansys Logo check box determines whether or not the Ansys logo is included in the title page. The Ansys logo is shown in Figure 3.2: A Sample Report, Part 1.
The Current Date check box determines whether or not the date and time are included in the title page.
The Table of Contents check box determines whether or not a table of contents is included in the title page. An example is shown in Figure 3.2: A Sample Report, Part 1.
Each entry in the table of contents is an active link to the corresponding section of the report. To follow a link, click the link using the left mouse button.
The Captions in Table of Contents check box controls the level of detail in the entries in the table of contents. When this check box is selected, the entries in the table of contents that link to objects in the report contain the titles of the objects.
A File Report object containing a file
information table, is automatically generated for each loaded results
file, and listed under the Report object. There
are no user-adjustable settings except the check box in the tree view,
which controls whether or not the file information is included in
the report. An example of the file information table is shown in Figure 3.2: A Sample Report, Part 1.
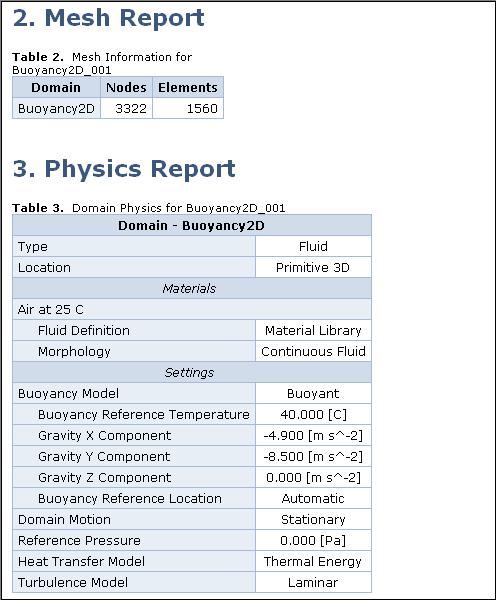
A Mesh Report object is automatically generated
and listed under the Report object. The Mesh Report object contains settings for a mesh information
table and a mesh statistics table. Examples of the mesh information
table and mesh statistics tables are shown in Figure 3.3: A Sample Report, Part 2. The data in these tables are the same as given
by the mesh calculator. For details, see Mesh Calculator.
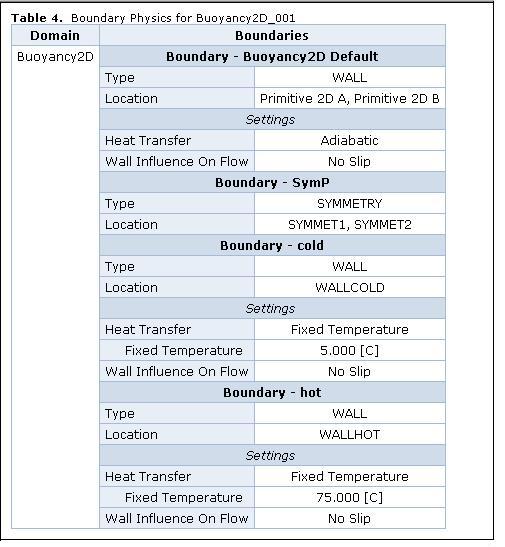
A Physics Report object is automatically
generated and listed under the Report object
only when you load a CFX-Solver results file. The Physics Report object allows you to control the output
of physics summary data for domains and boundaries. Examples of the
physics summary tables are shown in Figure 3.3: A Sample Report, Part 2.
A Solution Report object is automatically
generated and listed under the Report object
only when you load a CFX-Solver results file. The Solution Report object allows you to control the output
of boundary flow, force, and torque summaries in the report. CFD-Post uses
the summary data contained in the results files.
Note:
The units of the values displayed in a
Solution
         Report
object are based on the solution units used by CFX-Solver, rather than those selected in CFD-Post.The
Solution Reportobject uses monitor data from the CFX-Solver results file. Only the monitor data from the last time step or iteration will be used to generate the report table, regardless of which time step is loaded into CFD-Post for a transient case.Some CFX-Solver cases, particularly some transient blade row cases, do not contain the necessary monitor data to generate the tables. For these cases, the tables will be omitted even if the
Solution Reportobject is enabled.
An Operating Points object is automatically generated and listed under the Report object
only when you load a CFX-Solver results file from an operating point case (.mres).
The operating point parameter table for a given case is listed under Report > Operating Points > [case name].
The details view for the operating point parameter table has no settings.
To see the operating point parameter table in the Table Viewer, double-click it in the Outline tree view, or right-click it and select Edit.
The operating maps for a given case are listed under Report > Operating Points > [case name], and again under Cases > [case name] > Operating Maps.
The details view for an operating map is described in Operating Maps.
To see an operating map in the Operating Points Viewer, double-click it in the Outline tree view, or right-click it and select Edit.
You can create objects of the following types to add additional content to the report:
Tables
For details, see Table Command.
Charts
For details, see Chart Command.
Comments
For details, see Comment Command.
Figures
For details, see Figure Command.
Such objects are listed beneath the Report object in the tree view.
Report objects can be shown or hidden in
the report by setting the check box next to them in the Outline tree view. The changes take effect the next time
the report is refreshed or published.
You can control the order of Report objects
by selecting one or more, then right-clicking on the selection and
using the Move Up and Move Down shortcut menu commands as necessary. You can also press Ctrl+Up Arrow and Ctrl+Down Arrow to move
selected items.
To refresh the report, you can do any of the following:
Right-click the
Reportobject, or any of the report objects under it, then select from the shortcut menu.Click the button in the details view for the
Reportobject, or any of the report objects under it that have this button.Click the button in the Report Viewer.
Select File > Report > Refresh Preview.
Note: The first time you visit the Report Viewer after loading a results file, the report will be refreshed automatically.
After the report preview has been generated, you can view it in the Report Viewer.
You can publish a report so that it can be loaded into a third-party browser or editor. To publish a report, click the button in the Report Viewer toolbar to access the Publish Report dialog box, adjust settings as appropriate, and click . You can also access the same dialog box by doing any of the following:
Right-click the
Reportobject, or any of the report objects under it, then select Publish.Select File > Report > Publish.
Set Format to one of:
ARZWrites the report in ARZ format, an Ansys zipped report format that can be viewed using the Ansys Viewer. For details, see Ansys Viewer Basics in the Ansys Viewer User's Guide.
HTMLWrites the report in HTML format.
TextWrites the report in a plain text format.
Note: Existing HTML reports previously generated can be converted to .arz format by using an application supplied as part of the CFD-Post installation:
<CFDPOSTROOT>/bin/cfx5htmlconvert <html-file>You have the following options:
2D and 3D imagesBoth a 2D and 3D image is generated for each figure in the report. The 3D image can be viewed by clicking the 2D image in the report.
2D images onlyOnly a 2D image is generated for each figure in the report.
(applicable for HTML and Text formats)
Selecting the Save images in separate folder check box causes all image files to be put in a directory that is beside the main output file.
The button opens the Publish
Options dialog box. The Publish Options dialog box offers
the same settings as the Report object (accessible through the Outline
tab), and overrides the latter for the purpose of publishing the report.
Note: The Publish Options dialog box settings
are overwritten with the settings of the Report object if you change or otherwise apply the settings of the latter.