VM252
VM252
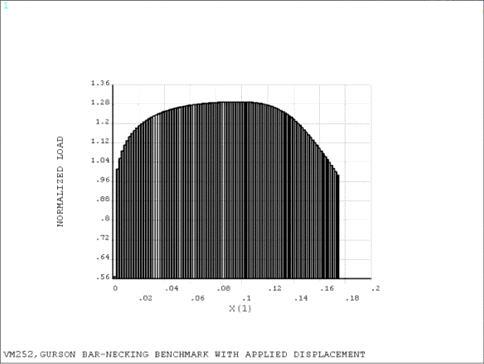
Gurson Bar-Necking Benchmark with Applied Displacement
- 2D Analysis
Test Case
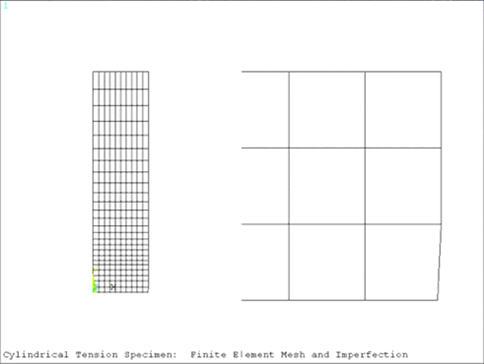
The model represents the necking of an axisymmetric specimen.
The initial radius of the specimen was described to be 1" and
the length was set to four times the initial radius. A slight imperfection
is found at the bottom of the model to create the initial notch, which
is offset by 0.005*Ro. For clarification,
the finite element mesh and the geometric imperfection are found in Figure 428: Representative Finite Element Model. To initiate growth of the notch, a displacement
in the y-direction was applied to the top of the model that was set
to 0.7602".
Analysis Assumptions and Modeling Notes
A 2D analysis is performed with both PLANE182 and PLANE183 elements. Two material models
are introduced into the model, an elastic and Gurson model. The elastic
model is based upon a power law and is presented for hardening purposes.
The coefficients for input were taken from the reference provided.
Due to the nonlinear behavior and complexity of the problem,
it is suggested to first increase the number of substeps within the
solution module until convergence is reached or perform mesh refinement.
Within the provided input listing, the total force along y = 4.0"
is recorded and plotted against x, where x is defined by the following
relationship: x = log(1+ dispY/Lo).
Graphical Results Comparison
Numerical Results Comparison