VM116
VM116
Heat Conducting Plate with Sudden Cooling
Analysis Assumptions and Modeling Notes
A 1 ft2 area is assumed for the conduction
elements. The length of the convection element is taken as zero (arbitrarily
selected). The finite element model is made the same as the theoretical
model for a direct comparison. A steady-state solution is done in
the first load step. Automatic time stepping is used. The initial
integration time step (7/20 = 0.35 hr) is based on
 δ2/4α, where δ
is the nodal distance within the element (1/12 ft), and α is
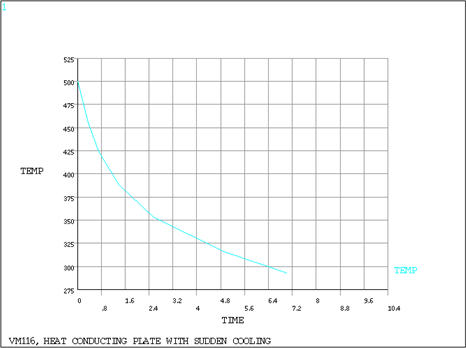
the thermal diffusivity k/γc = 0.003 ft2/hr). POST26 and POST1 are used to obtain the surface temperature
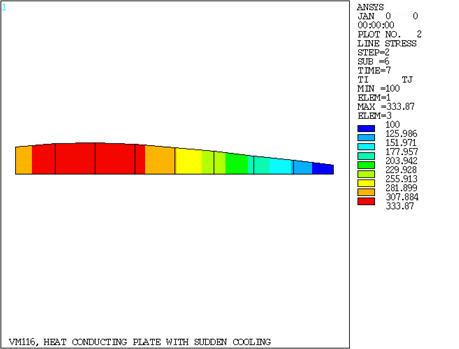
history and the temperature distribution at the final time step, respectively.
δ2/4α, where δ
is the nodal distance within the element (1/12 ft), and α is
the thermal diffusivity k/γc = 0.003 ft2/hr). POST26 and POST1 are used to obtain the surface temperature
history and the temperature distribution at the final time step, respectively.
Results Comparison
Based on graphical estimates
Temperature at Node 2


 initially has its left surface at temperature T1 and the other surface at temperature T2.
The left surface is suddenly subjected to an environment temperature
of T
initially has its left surface at temperature T1 and the other surface at temperature T2.
The left surface is suddenly subjected to an environment temperature
of T
 = T2. The convection coefficient on this side is given by h = 2.0 +
0.02 (T - T
= T2. The convection coefficient on this side is given by h = 2.0 +
0.02 (T - T
 ) where T is the surface
temperature (function of time). Determine T after 7 hours. Graphically
display the variation of T with time and the temperature distribution
across the plate at 7 hours.
) where T is the surface
temperature (function of time). Determine T after 7 hours. Graphically
display the variation of T with time and the temperature distribution
across the plate at 7 hours.