VM114
VM114
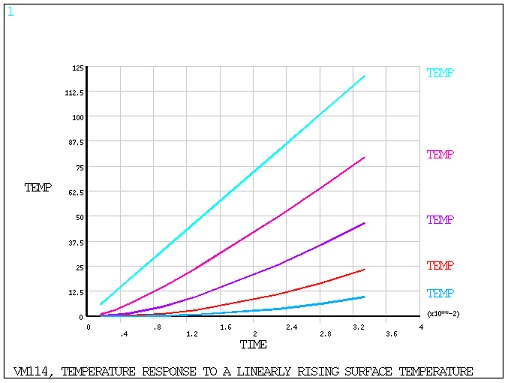
Temperature Response to Increasing Temperature
Test Case
A semi-infinite solid, initially at a temperature To, is subjected to a linearly rising surface temperature Ts = 3600 t, where Ts is in °F and t is time in hours. Determine the temperature distribution in the solid at t = 2 min.

| Material Properties | Loading | |||||
|---|---|---|---|---|---|---|
|
|
Analysis Assumptions and Modeling Notes
A nonuniform mesh is used to model the nonlinear thermal gradient through the solid. An arbitrary area of 1 ft2 is used for the elements. The length of the model is taken as 0.3 ft assuming that no significant temperature change occurs at the interior end point (Node 2) during the time period of interest (2 min). This assumption is validated by the temperature of node 2 at the end of the transient analysis.
Automatic time stepping is used with an initial integration time step (0.03333/20 = 0.001666 hr) greater than δ2/4α, where δ = minimum element conducting length (0.0203 ft) and α = thermal diffusivity ( = k/ γc = 0.1 ft2/hr).
Note that the KBC key (not input) defaults to zero, resulting in the surface temperature load being ramped linearly to its final value.
POST26 and POST1 are used to obtain the temperature history at the node locations, and the temperature distribution at t = 0.03333 hr, respectively.
Results Comparison
| Time = 0.03333 hr | Target | Mechanical APDL | Ratio | |
|---|---|---|---|---|
| T, °F (Node 1) | @ x = 0.0 ft | 120.00 | 120.00 | 1.000 |
| T, °F (Node 3) | @ x = 0.0203 ft | 79.32 | 79.07 | 0.997 |
| T, °F (Node 4) | @ x = 0.0441 ft | 46.62 | 46.35 | 0.994 |
| T, °F (Node 5) | @ x = 0.0719 ft | 23.44 | 23.25 | 0.992 |
| T, °F (Node 6) | @ x = 0.1044 ft | 9.51 | 9.52 | 1.001 |
| T, °F (Node 2) | @ x = 0.3 ft | 0.0 | 0.03 | - |