


The following figure shows the distribution of the y-component of stresses at approximately the same time step:
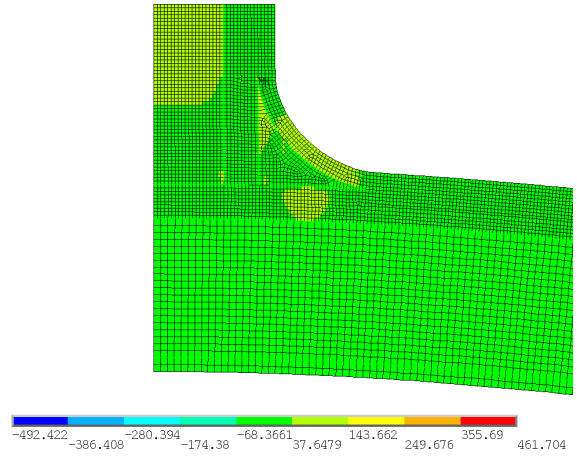
Initially, the stresses become high around the crack tips, especially near the crack (located at the curve area). As the stress increases, the energy-release rate at the crack tip also increases and reaches the critical value. Fracture occurs when the following fracture criterion is met:

where fc is the fracture-criterion ratio. The recommended ratio is 0.95 through 1.05. The default is 1.0.
The following table shows the energy-release-rate values for the crack tips in the model at two different time steps, before and at the time of crack-growth:
| Energy-Release Rate and Fracture-Criterion Ratio | |||||
|---|---|---|---|---|---|
| Crack ID | Time | GI | GII |

| fc (default = 1) |
| 1 | 0.030178 | 7.17E-02 | 0.43018 | 0.66920333 | f < fc |
| 0.035178 | 0.79123 | 2.4774 | 5.11483333 | f > fc | |
| 2 | 0.030178 | 0.073927 | 0.37991 | 0.62633333 | f < fc |
| 0.035178 | 0.45969 | 1.9227 | 3.455 | f > fc | |
| 3 | 0.030178 | 0.055529 | 0.43103 | 0.61612667 | f < fc |
| 0.035178 | 0.29733 | 0.9005 | 1.8916 | f > fc | |
| 4 | 0.030178 | 0.023272 | 0.67118 | 0.74875333 | f < fc |
| 0.035178 | 0.07832 | 1.6736 | 1.93466667 | f > fc | |
The table data show that crack-growth occurs first at crack tips 1 and 2, whereas crack-growth at crack tips 3 and 4 occurs a little later. This behavior indicates that the dominant delamination occurs along the interface between the deltoid and overlaminate in the curve area first, then between the UD braid and the deltoid. Also for crack tip 1, 2 and 4, the fracture criteria ratio is much higher than after crack-growth is initiated, indicating an unstable crack-growth. To avoid overpredicting the maximum loading, use a smaller minimum time step (DTMIN) value.
The following figure shows the energy-release rate increasing until failure occurs:
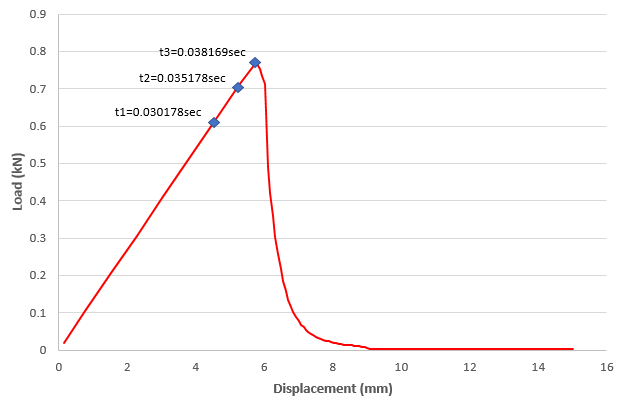
The figure shows the variation of reaction force with the displacement in the Y direction. The response of the T-joint model at times t1, t2 and t3 indicates that the reaction force increases first and reaches the maximum value before crack-growth initiation. After time t3, almost all cracks begin to grow. When crack-growth begins, the force drops suddenly and decreases steadily.
Delamination is easily observed by the deformation of interface elements or by hiding the interface elements from the model in postprocessing.
The following figures show the delamination of the panels at various time steps:
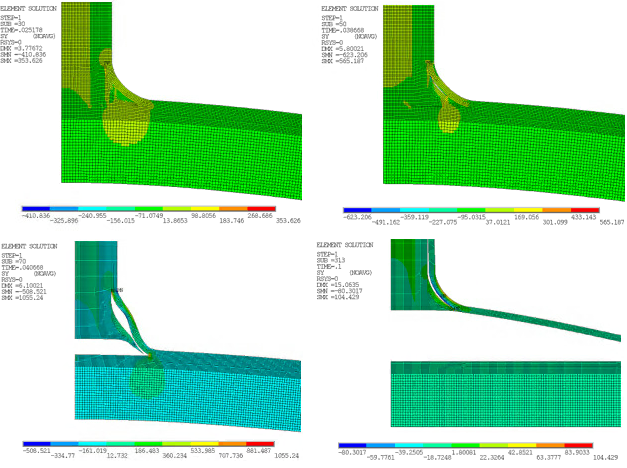
The crack-growth from crack tips 1 and 3 eventually merge, thereby separating the laminated panels.
The T-joint is analyzed using the existing debonding capability with contact
elements. A cohesive zone model (CZM) describes the behavior of the contact
interface. The model uses an option to define bilinear material behavior with
tractions and critical fracture energies
(TB,CZM,,,,TBOPT = CBDE).
The boundary conditions and loading are the same as in the VCCT model, and predefined crack models are used with the same crack sizes.
The following table shows the input parameters for the CZM model:
| CZM T-Joint Model Parameters | ||
|---|---|---|
|
Maximum normal contact stress (MPa) | σmax |
45 |
|
Critical fracture energy for normal separation (N/mm) | Gcn |
0.3 |
|
Maximum equivalent tangential contact stress (MPa) | τmax |
35 |
|
Critical fracture energy for tangential slip (N/mm) | Gct |
1.0 |
|
Artificial damping coefficient (sec) | η |
5E-04 |
|
Flag for tangential slip under compressive normal contact stress | β |
1 |
The following example input defines the cohesive zone model:
C1=45
C2=0.3
C3=35
C4=1.0
C5=5E-04
C6=1

TB,CZM,6,,,CBDE            ! Cohesive zone material
TBDATA,1,C1,C2,C3,C4,C5,C6

TB,CZM,7,,,CBDE            ! Cohesive zone material
TBDATA,1,C1,C2,C3,C4,C5,C6
The following figures show the Y-component stresses in the VCCT and CZM models with identical meshes.
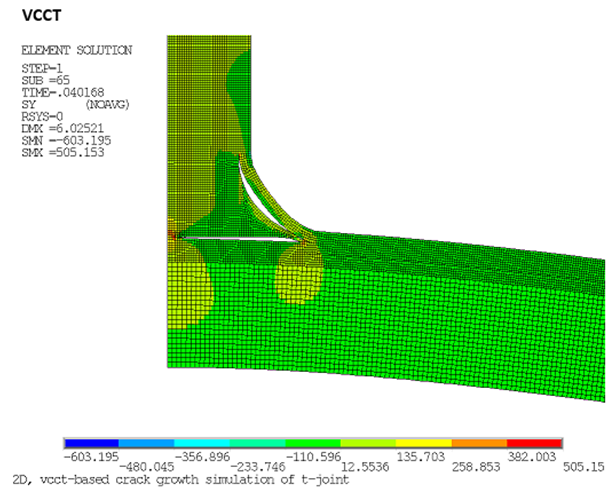
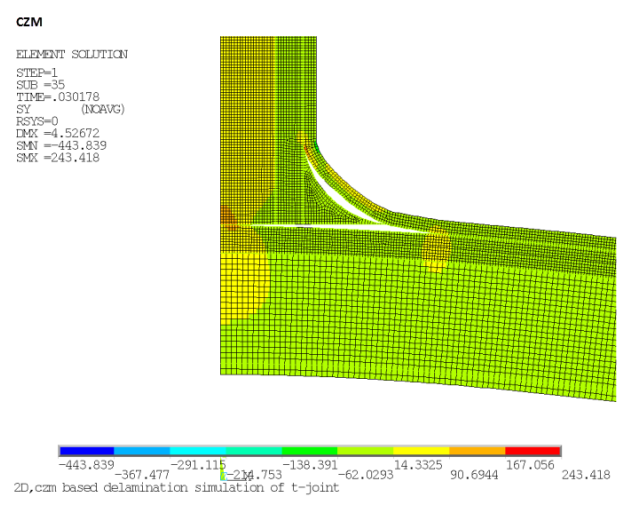
Similar to the VCCT model, the debonding in CZM starts from the curved crack portion, then merges with the debonding from the horizontal cracked portion, thereby separating the laminated panels.
The following figure shows the force-deflection (Y-force vs. Y-displacement) response of delamination for the two models:
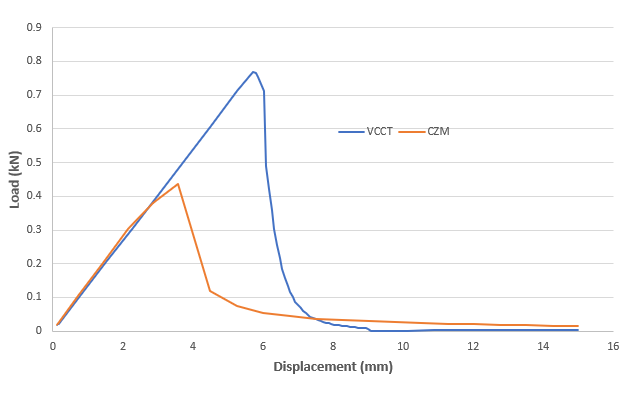
For both models, the force increases with the applied displacement and peaks quickly before the crack begins to grow. The reaction force then decreases rapidly at the initial phase of crack-growth, then slows with the subsequent crack-growth.
A slight difference in the results is observed because the fracture criterion used for VCCT crack-growth is linear and critical fracture energy based only, while the delamination for CZM model is based on interlaminar strengths along with critical energy. An artificial damping coefficient also affects the convergence of the CZM model. Furthermore, in the VCCT model, the nodes separate instantaneously when the fracture criterion is reached, implying that the load-carrying capacity drops more rapidly than it does in the CZM model.