


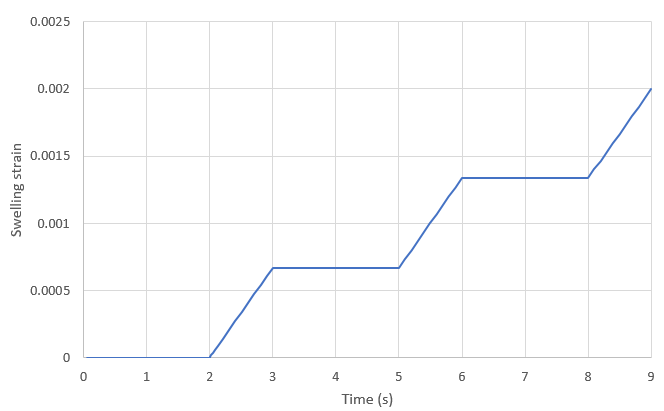
The following two figures show that the swelling strains and thermal strains are consistent with TGO growth and temperature loadings, respectively, for the first three cycles:
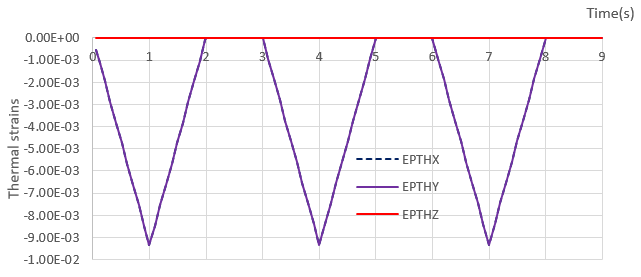
Initially, the TBC is stress-free at 1000˚C and Time = 0.
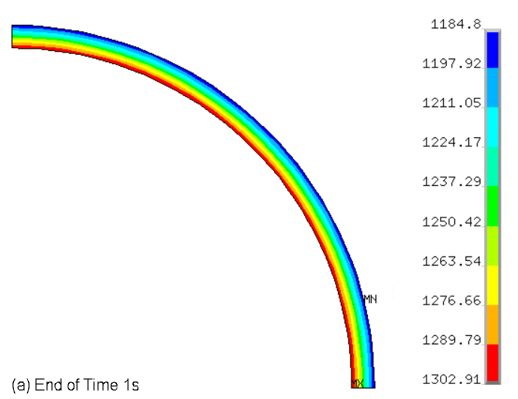
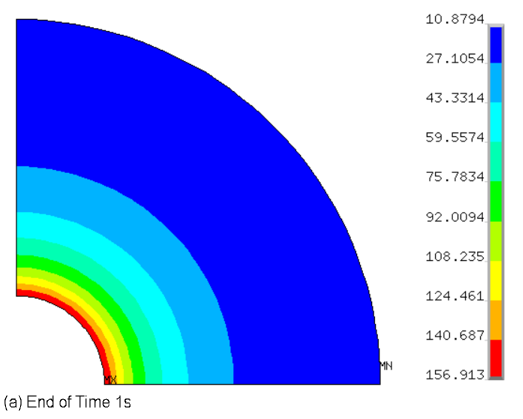
The following two figures show that as the temperature decreases from 1000˚C to 0˚C, the stress increases in both the TGO (6a) and the bond coat (7a). The maximum values of von Mises stress of the TGO and the bond coat (1303 MPa and 157 MPa, respectively) are lower than the yield stresses of the TGO and bond coat, indicating that both the TGO and the bond coat are in the elastic stage.
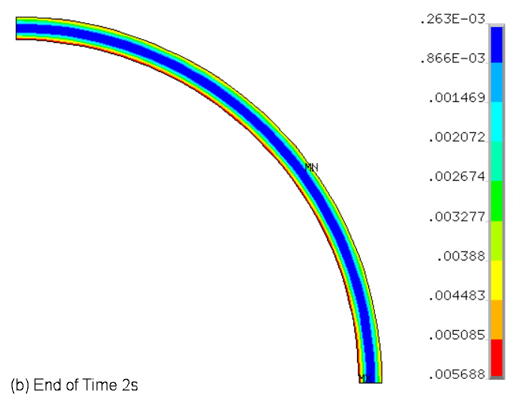
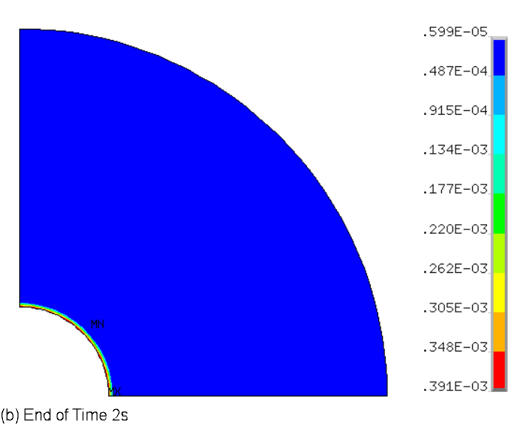
After the TBC temperature is again increased to 1000˚C, the thermal strains of the TGO and the bond coat become zero. The TGO and bond coat therefore have near-zero stress at the end of Time = 2s.
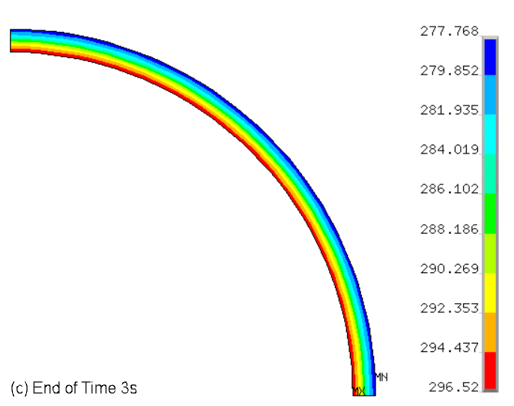
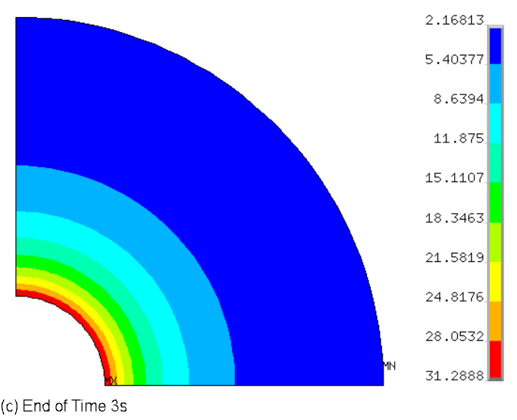
While the temperature remains constant at 1000˚C and the TGO grows, the stress of both the TGO and the bond-coat increases at the end of Time = 3s.
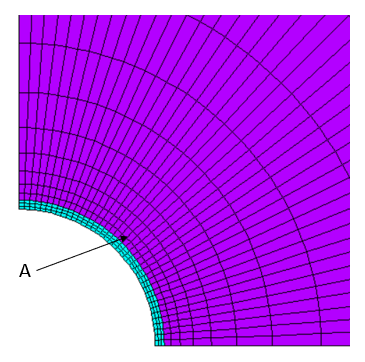
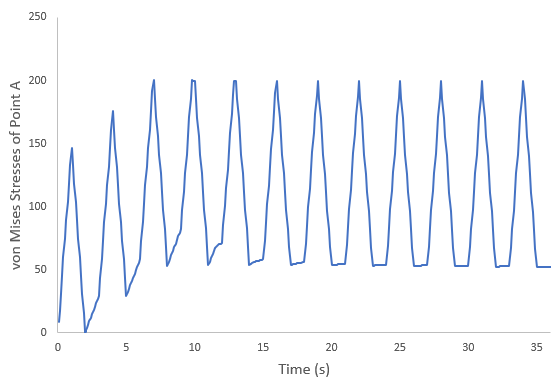
A material point on the bond coat close to the TGO (point A in the following figure) is chosen for a closer examination of the time-history of the solution results. The time-history of the von Mises stress for the first 12 cycles shows that, for the first two cycles, the material point is within the elastic regime. As the growth strain in the TGO increases, plastic yielding in the material occurs.
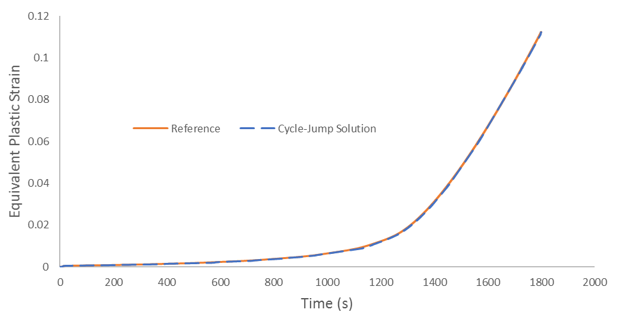
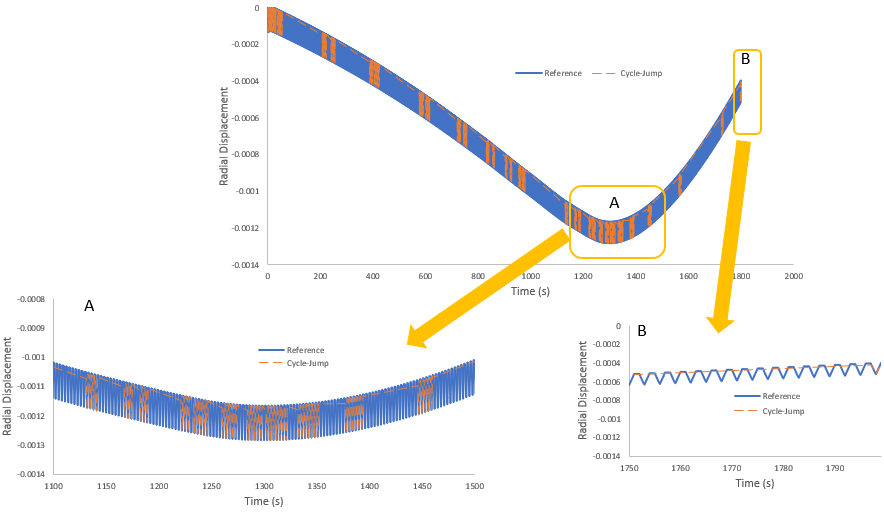
The cycle-jump solution is compared against a reference solution obtained from the model without using the cycle-jump method. In the following figure showing the time-history of the equivalent plastic strain and radial displacement at point A, the cycle-jump solution agrees well with the reference solution:
The following three figures show the final cycle-jump contour plot results (Time = 300s) along with the reference solution results:
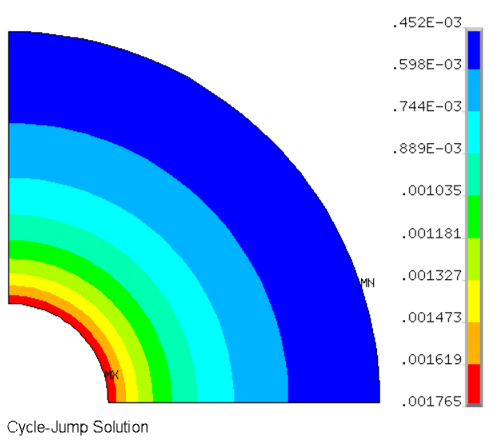
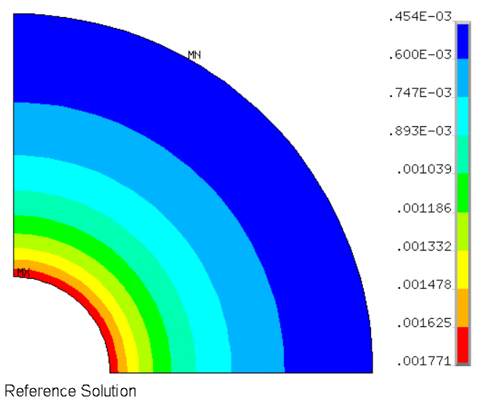
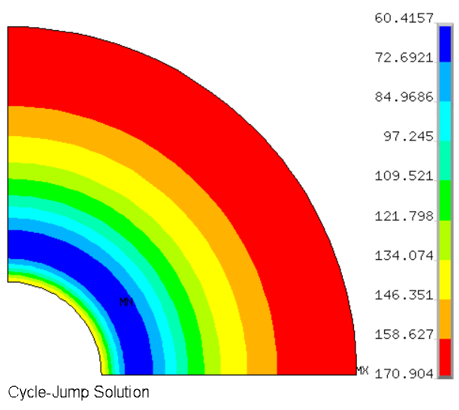
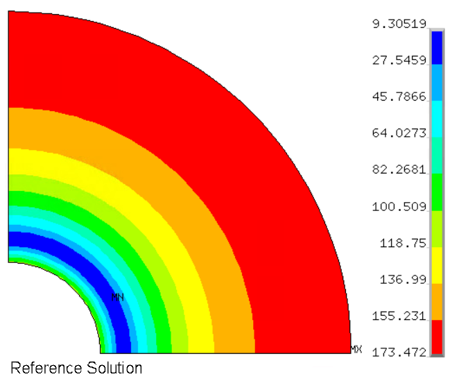
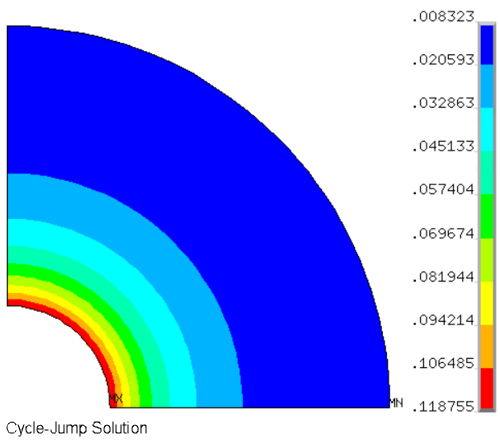
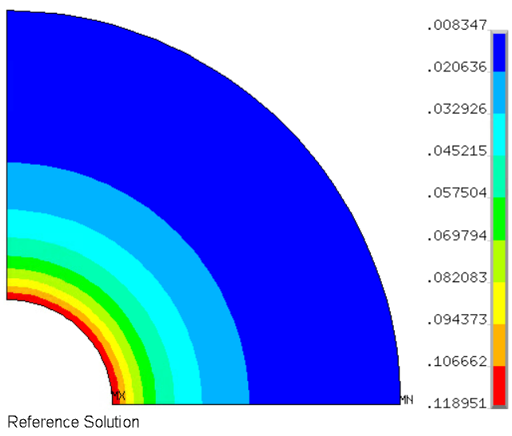
The deformation, von Mises stress, and von Mises plastic strain of the bond coat are very close to the reference solutions.
For this analysis, 454 of the 600 loading cycles were jumped.