


The entire solution concludes in 14.1 hours with 32 processors (Intel(R) Xeon(R) CPU E7-8867 v3). The results show 123 cycles jumped, about 49 percent of the total number of cycles. The solution using the cycle-jump method is compared against the results from a full solution (without cycle-jump).
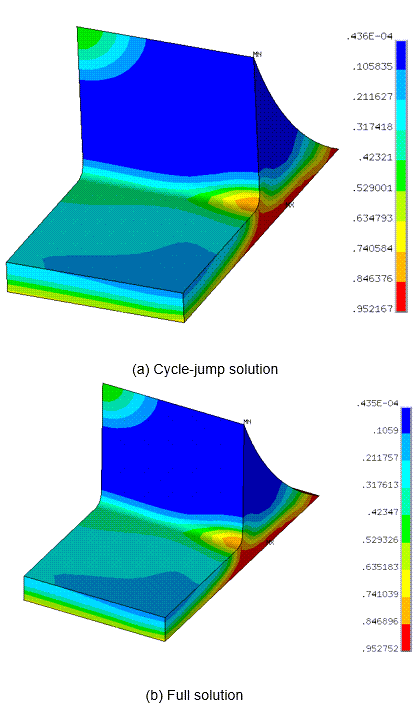
The final damage of the solder joint shows that the peak value and distribution of the final damage of the solder joint of the cycle-jump solution match those from the full simulation:
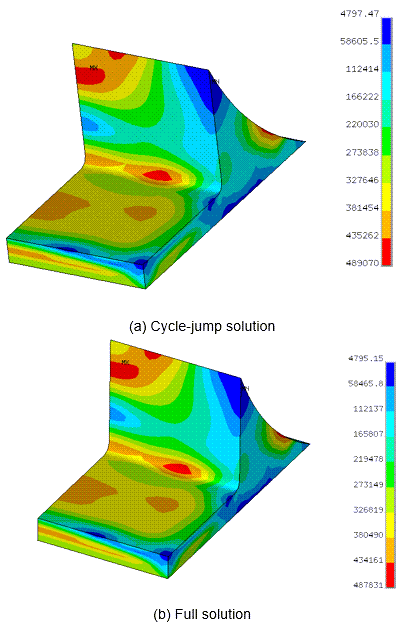
The same applies for the final equivalent stresses:
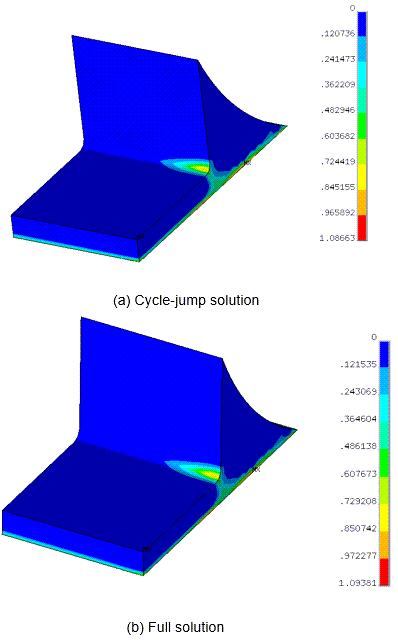
The maximum value of accumulated plastic strain with jump exhibits less than a 1 percent difference from the full solution:
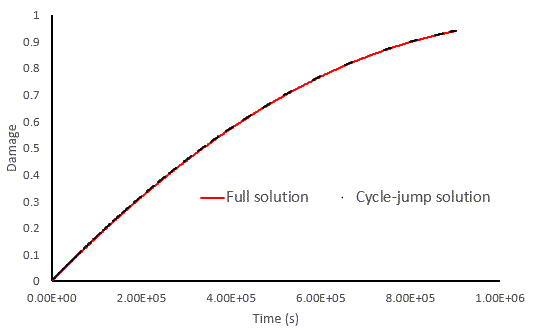
The damage of element 7438 over time shows that the damage from the cycle-jump solution is identical to that of the full solution:
After accelerating of the solder-joint fatigue analysis via the cycle-jump method, the results obtained (damage, equivalent stress, and accumulated plastic strain) are remarkably close to those obtained from the full solution (without cycle-jump), yet the total computational time is approximately half that of the full solution:
Table 69.1: Comparison of Cycle-Jump Solution With Full Solution
| Solution | Computation Time (Hours) | Running Cycles | Final Maximum Damage | Final Maximum Von Mises S (MPa) |
Final Maximum Accumulated Plastic Strain |
|---|---|---|---|---|---|
| Cycle-jump | 14.1 | 127 | 0.952 | 0.489 | 1.087 |
| Full | 27.8 | 250 | 0.953 | 0.488 | 1.094 |