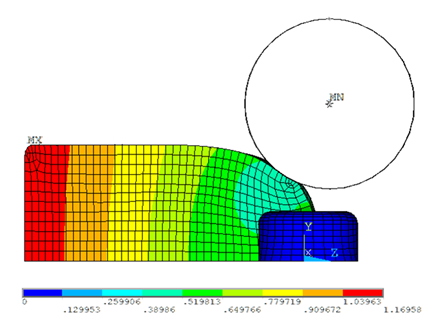
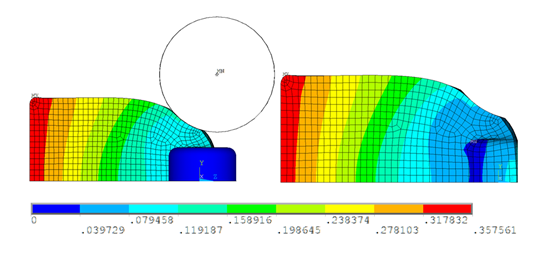
The following figure shows the deformation plot (USUM) of the initial run at the last converged substep (TIME = .7718).
Following the successful rezoning, the following figure shows the deformation plot (USUM) of the model after building up the rolling process (at the end of the first load step):
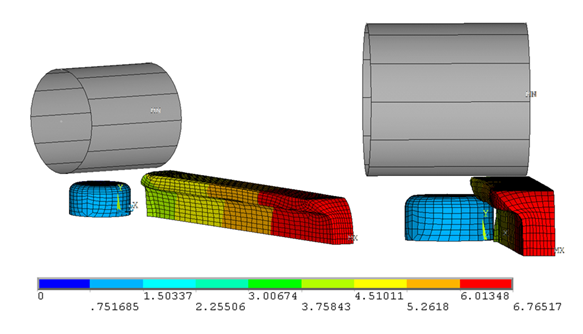
The hot-rolling process is performed in the second load step by rotating the rollers and using high-friction contact between the rollers and the billet. The following figure shows the deformation plot (USUM) of the model at the end of the second load step:
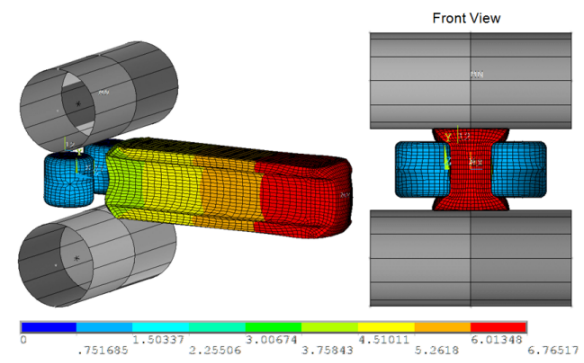
To view the full-model results, two symmetric expansions (/EXPAND) are performed.
Example 27.9: Performing the Symmetric Expansion
! Create local Cartesian coordinate system (using three nodes)
!   on the YZ symmetry plane of the block
CS,11,0,28752,29076,28734,1,1
! Perform symmetric expansion
/EXPAND,1,LRECT,HALF,,.000001,,1,LRECT,HALF,,,.000001, ,RECT,FULL
The following figure shows the deformation plot in the fully expanded model, where the rectangular block becomes an I-shaped beam:
The following figure shows the variation of the X component of the moment along with the time for the top roller:
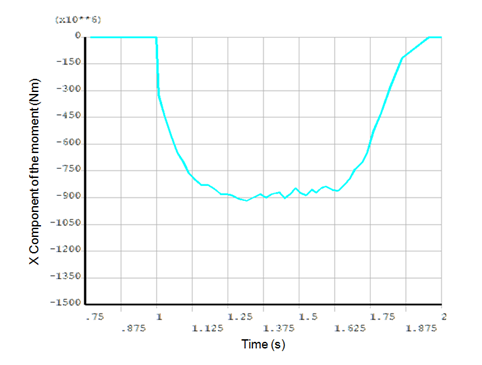
The plot suggests that rolling moment varies little from TIME = 1.25s to TIME = 1.6. The hot-rolling process during this time range can be considered to be steady state.
Similarly, the following figure shows the variation of the force components of the top roller:
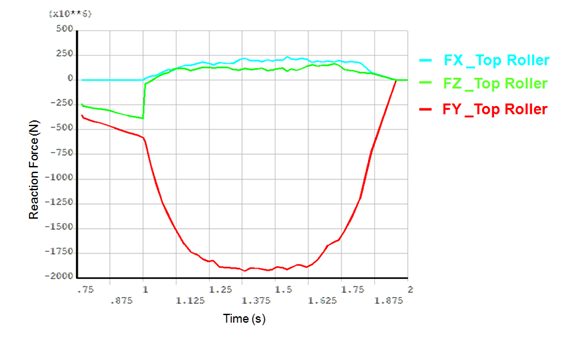
The plot also shows that forces vary little from TIME = 1.25 to TIME = 1.6s. As expected from the top roller, the Y component of the force (that is, the downward force) is dominant in the rolling process.
The following figure shows the equivalent plastic strain plot in the fully expanded model:
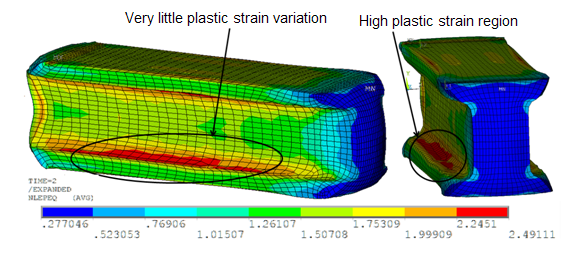
As expected, the high plastic strain region is observed at the location where the web and flange components of the I-beam are connected.
For some duration in the rolling process, the plastic strain varies little over time in the high plastic strain region. This behavior occurs during the steady-state (rolling) phase of the simulation.