


The primary results are obtained as RMS acceleration values on the entire structure via the POST1 postprocessor (SET,5,1).
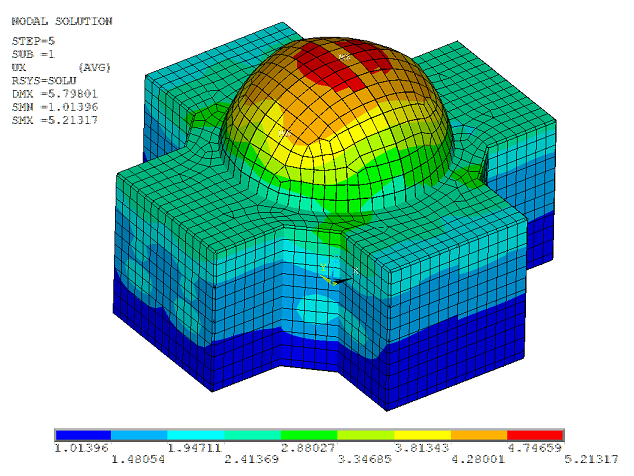
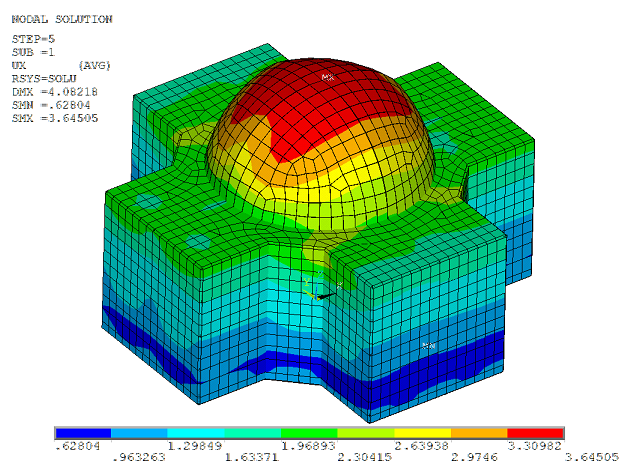
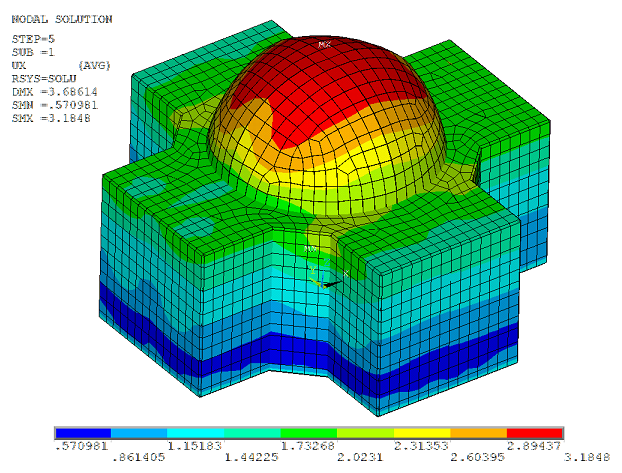
Figure 34.7: 1-σ Absolute Acceleration Values on NPP
|
(A) and (B) show that the motion incoherency effects on the nodal solutions are significant, and that the overall response has been reduced. (B) and (C) reveal that the consideration of wave-passage effects further reduces the overall response. |
| (A) Fully Coherent Input with No Wave Passage Effect |
 |
| (B) Partially Coherent Input with No Wave Passage Effect |
 |
| (C) Partially Coherent Input with Wave Passage Effect |
 |
The plots provide information about the overall response reduction only. To derive the frequency-by-frequency reduction ratio, the acceleration response PSDs at various locations of the structure using both coherent and incoherent inputs are compared.
The following figure shows a comparison of response PSDs obtained at the building centerline at five different elevations (RPSD):
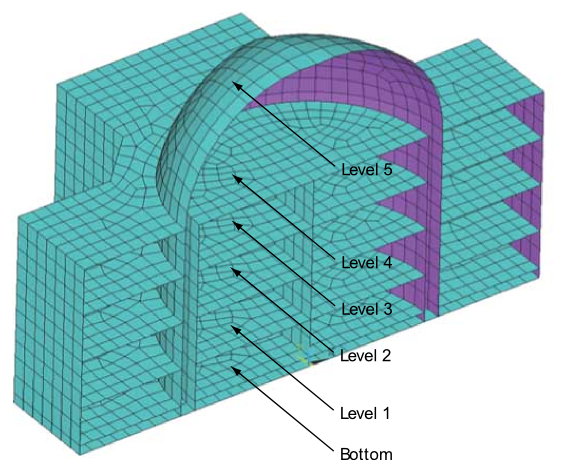
The following figure shows the results for levels 1, 4, and 5:
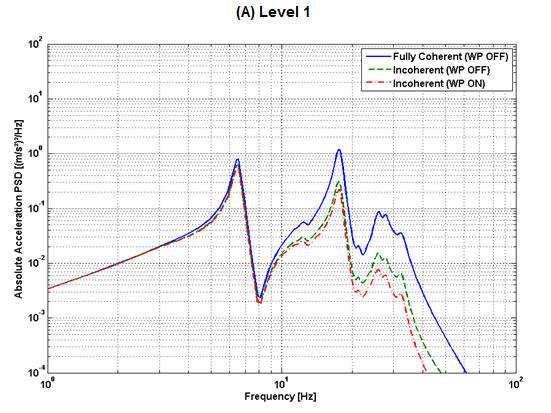
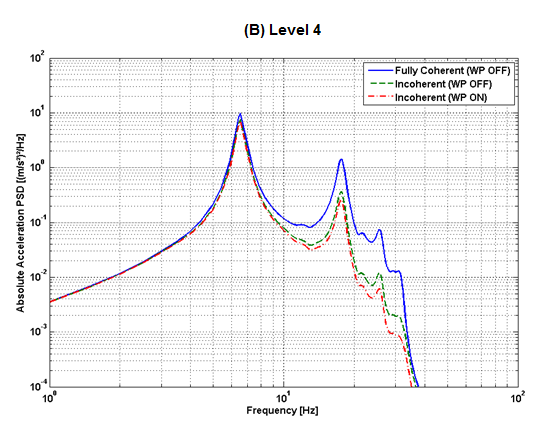
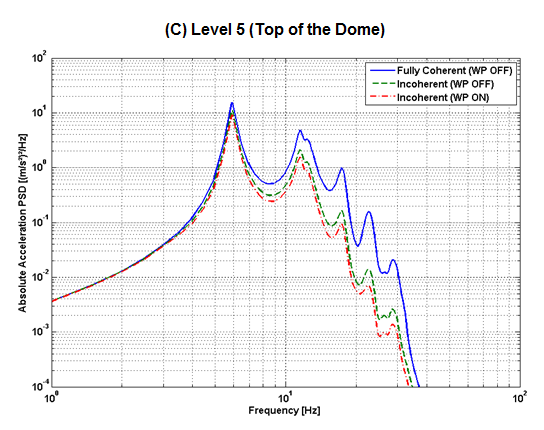
The observations are as follows:
In Eastern United States rock sites, ground motions generally exhibit high energy content for frequencies 10 Hz and above. When high-frequency ground motion is applied to the NPP model, it is expected that out-of-phase high-frequency modes will be randomly distributed across the foundation footprint in accordance with the specified coherency function. The incoherency effect should therefore reduce the high-frequency responses.
The motion incoherency effects reduce the responses for all frequency ranges, especially in the high-frequency range above 10 Hz. For frequencies below 10 Hz, the responses are virtually identical for incoherent and coherent ground inputs.
The combined effects of motion incoherency and wave-passage effects are significant, and they further reduce the responses in the high-frequency range.
The points situated farthest from the excitation location are affected more by incoherent input as a result of the smearing effect due to numerous contributors.
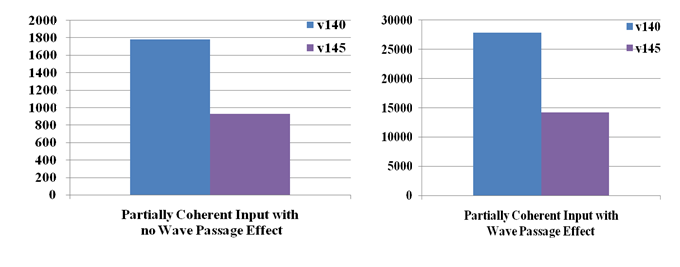
To expose the parallelism of the analysis procedure, both Mechanical APDL R14.0
and R14.5 are used. Shared-memory parallelism (SMP) is initially activated with two
processing cores (invoked via the –np command in batch
runs).
The following table shows the performance gains:
Table 34.2: Comparison of Wall Time
| Fully Coherent Input with No Wave Passage Effect | Partially Coherent Input with No Wave Passage Effect | Partially Coherent Input with Wave Passage Effect | |||||||
|---|---|---|---|---|---|---|---|---|---|
| Solution Time (Sec) | PSD Table | Post- Processing Time (Sec) | Solution Time (Sec) | PSD Table | Post- Processing Time (Sec) | Solution Time (Sec) | PSD Table | Post- Processing Time (Sec) | |
| R14.0 | 12 | 1 | 10 | 1785 | 21 | 1908 | 27852 | 68 | 31519 |
| R14.5 | 10 | 1 | 6 | 927 | 21 | 723 | 14196 | 68 | 14196 |
The following figure shows the solution time (the covariance matrix calculation) required for the PSD analyses with partially coherent input motion with and without the wave-passage effect:
The following figure shows the time required for the response PSD calculation (the POST26 elapsed time) or the PSD analyses with partially coherent input motion with and without the wave-passage effect:

Both figures show that the elapsed time for solution and postprocessing is substantially lower in Mechanical APDL R14.5.
It is of interest to evaluate the scalability of SMP on Mechanical APDL R14.5 using various numbers of cores, with a maximum of 8 cores.
The following table shows the wall time of the PSD analyses with partially coherent input motion with wave-passage effect for various numbers of cores:
Table 34.3: Comparison of Wall Time for Various Numbers of Cores (R14.5)
| 2 Cores | 4 Cores | 8 Cores | ||||
|---|---|---|---|---|---|---|
| Partially Coherent Input with Wave Passage Effect | Solution Time (Sec) | Postprocessing Time (Sec) | Solution Time (Sec) | Postprocessing Time (Sec) | Solution Time (Sec) | Postprocessing Time (Sec) |
| 14196 | 14196 | 7316 | 7274 | 3867 | 3728 | |
The following figure shows the solution time (covariance matrix calculation) required using various numbers of cores:
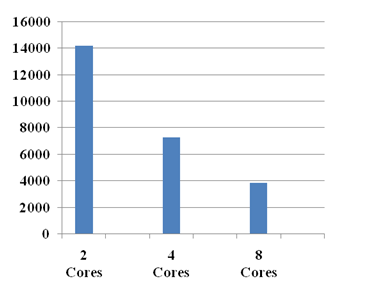
The same trend is observed for the POST26 postprocessing wall time.
Computational time spent on solution and postprocessing for four cores is nearly half that of two cores, meaning that a performance increase up of about 2x is achieved. Similar comparisons have also been observed with eight-core and four-core runs. It can therefore be concluded that the scalability of the SMP-based solver is good.