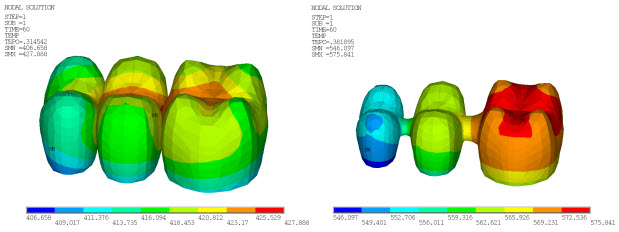
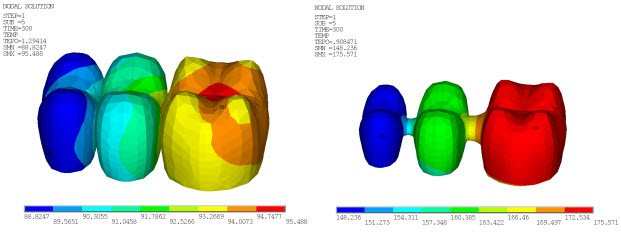
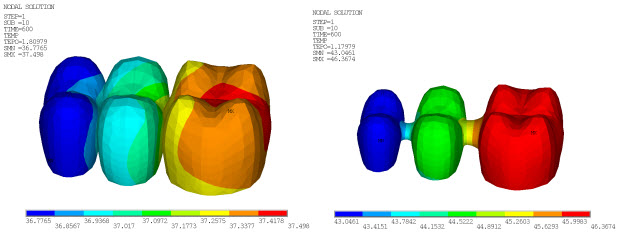
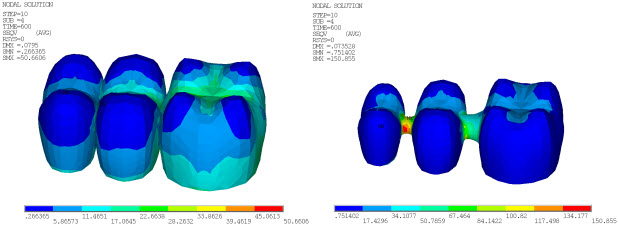
The following three figures show the distribution of temperature at different time steps in both the FPD veneer and core, with the temperature for both reaching the steady-state room temperature at 600 seconds:
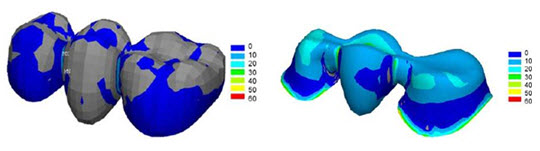
The following three figures show the von Mises stress distribution at different time steps in both the FPD veneer and core:
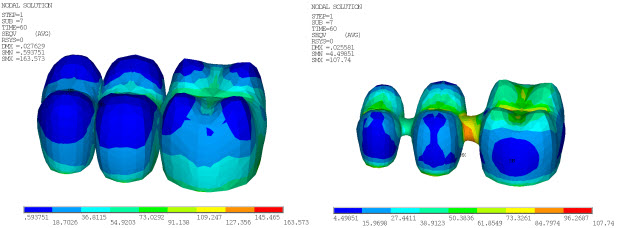
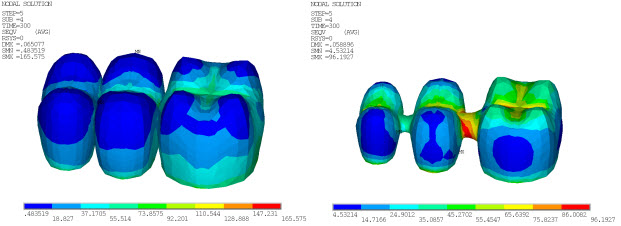
The von Mises stresses in both veneer and core change with temperature due to natural convection on the veneer surface. The stresses correspond to temperature loadings at 60, 300 and 600 seconds. At high temperatures, the von Mises stresses are very high in the veneer as compared to the core.
As the veneer cools through the transition, the elastic moduli no longer relax on the time scale of the cooling and--due to the different thermal contraction coefficients of the veneer and core--a jump in the stress distribution occurs at the veneer-core interface, bringing the higher von Mises stresses in the veneer close to the core stress at room temperature.
Stresses in the inner veneer surface at the interface are not significantly different from the core outer surface stresses due to the stabilized fictive temperature (equal to the actual temperature) at lower temperatures.
The following figure shows tension in the core and compression in the veneer at the room temperature residual stress pattern:
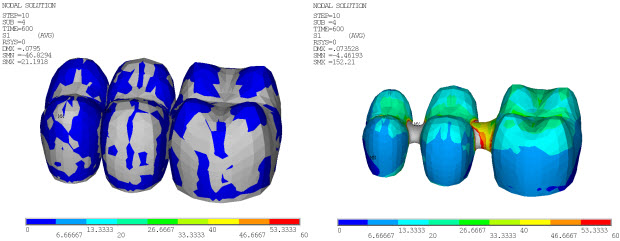
The tension is present because the surface cools most rapidly and becomes rigid, while the inner surface of the veneer (at interface with the core) is still at a higher temperature. When the interface becomes rigid and cools, it forces the surface under more compression. These residual stresses can be used for analyzing FPDs under occlusal loading in the oral cavity and subsequently to predict the life of the FPDs.[1]
The following figure shows the maximum residual principal stress distribution in the veneer and the core from the reference results [1], which agree closely with the simulated results from this problem: