Figure 26.8: Comparison of Cumulative Iterations for Different Contact Detection Methods and Table 26.1: Simulation Statistics for Different Contact Detection Methods illustrate the following advantages of the surface-projection-based contact method by comparing it with other available contact detection algorithms.
Compared to other methods, the surface-projection-based contact method (KEYOPT(4) = 3) requires the least number of cumulative iterations to solve this problem.
Convergence of the problem is less sensitive to the normal contact stiffness factor (FKN) when using the surface-projection-based contact method (KEYOPT(4) =3).
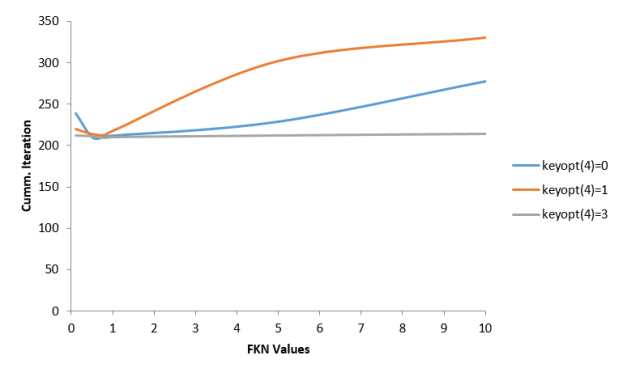
The surface-projection-based contact method (KEYOPT(4) = 3) produces smoother contact forces than other contact detection algorithms. It is less sensitive to the magnitude of the contact stiffness.
For smaller values of FKN (0.1 to 1.0), the variation in cumulative iterations is less for all contact detection methods. But for the higher values of FKN (1 to 10), the variation in cumulative iterations for the surface-projection-based method is much less compared to the other contact detection methods. FKN = 1 is optimal for nonlinear analysis.
In general, the surface-projection-based contact method is much more expensive in computational time. In this particular model, the total number of iterations and substeps used with this method is less than for other contact detection algorithms. The overall performance using the surface projection method turns out to be better. This can be observed in the table below:
Table 26.1: Simulation Statistics for Different Contact Detection Methods
| KEYOPT(4) = 0; Gauss Point | KEYOPT(4) = 1; Nodal Point | KEYOPT(4) = 3; Surface Projection | |
|---|---|---|---|
| Substeps | 45 | 45 | 45 |
| Cumulative Iterations | 212 | 218 | 210 |
| Simulation Time (sec) | 1223 | 1218 | 1097 |
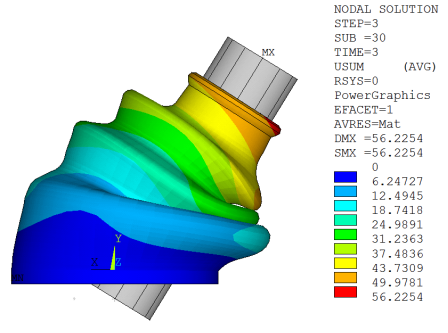
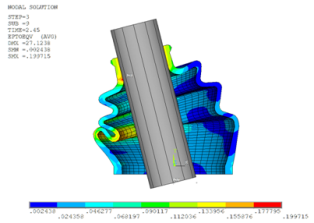
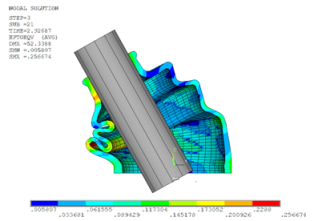
the following figure shows the displacement position of the boot at the maximum shaft angle:
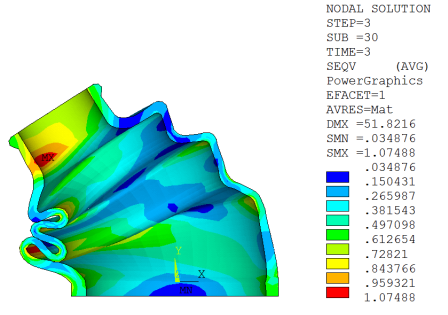
The following figure illustrates the location of the critical zones where the maximum stress occurs in the boot at maximum shaft angle. Although it is low, and considering the fatigue effects of the material after a given number of cycles, these areas are the most likely to fail under fatigue loads.
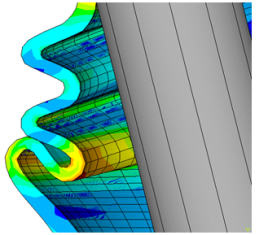
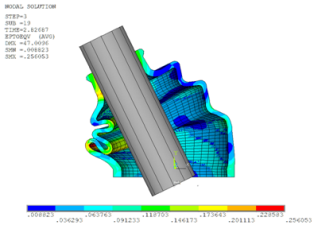
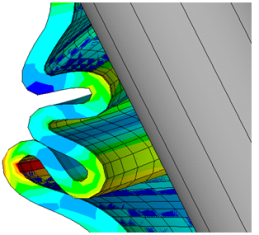
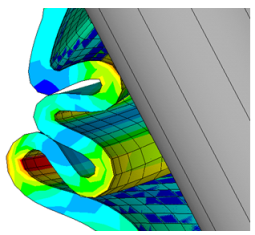
The following figures show total strain at different points of contact occurring in the rubber boot at different shaft angels. The first instance of contact occurs between the outer plaits of the rubber boot. After that, stretching is noticed in the first contact zone, and the second contact occurs between the inner plaits of the rubber boot. Finally, the third contact occurs between the inner plaits of the rubber boot and the shaft.
The following animation shows the von Mises stress, reaction force in the Y direction, and moment about the Z-axis through all load steps.