


To visualize the orbits after a modal or harmonic analysis has been performed, use the PLORB command in POST1.
Because the elliptical orbit is valid only for nodes on the rotational velocity axis, PLORB command is valid for current-technology beam and pipe elements. If you have a solid element model, you can add line elements (with negligible stiffness and mass) on the rotational velocity axis to visualize the orbits.
Sample command input to output your orbit plot at a given frequency:
/POST1
set,1,6          ! read load step 1, substep 6
plorb
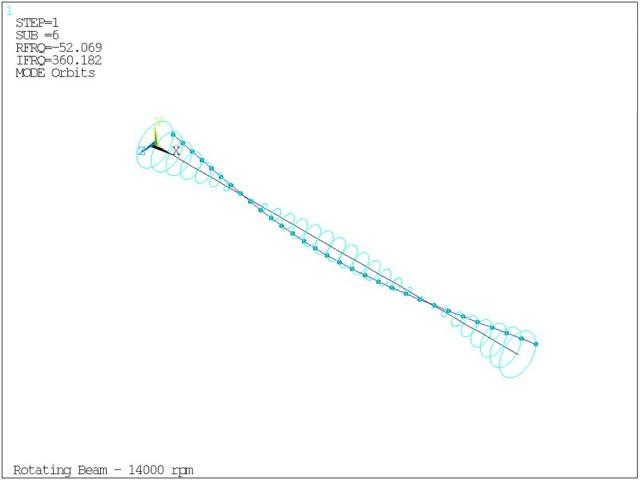
The spool line is in dark blue, while the orbits are in light blue.