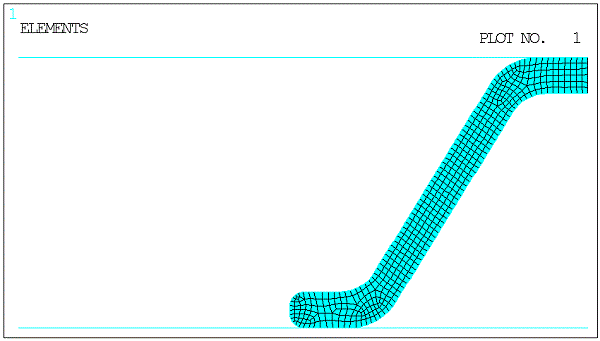
The model represents a half symmetry planar hyperelastic seal. Figure 1: Diagram of Planar Seal Model shows a diagram of the model, and Figure 2: Meshed Planar Seal Model shows the meshed half symmetry model.
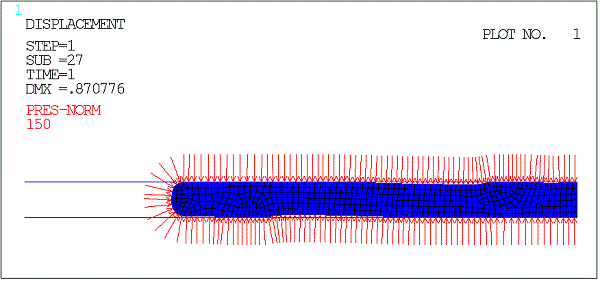
The seal is compressed by a displacement-controlled load in the first load step. Fluid pressure is applied to all contact elements in the second load step (see Figure 3: Fluid Pressure Loading on Planar Seal) so that the fluid opens and penetrates into the contact interface that was previously closed by compression.
The fluid pressure is applied using the SFE command with the load
key set to 1 (LKEY = 1 on SFE). Using
SFE with the load key set to 2 (LKEY =
2 on SFE), all default starting points are suppressed (STA1 = -1) and
two elements are chosen as starting locations initially exposed to the fluid (STA1 = 1).
(See Specifying Fluid Penetration Starting Points for more information on the STA values.) From
this location the fluid penetrates gradually by opening the bottom part of the contact
surface, while the top part of the contact surface completely closes.
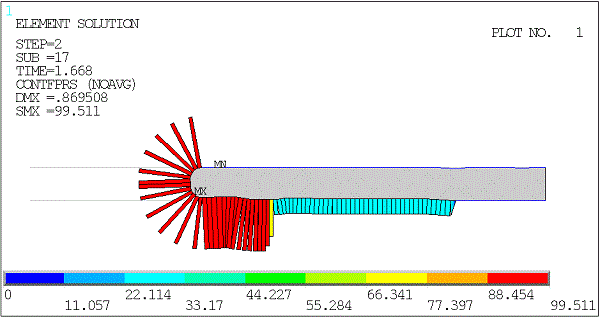
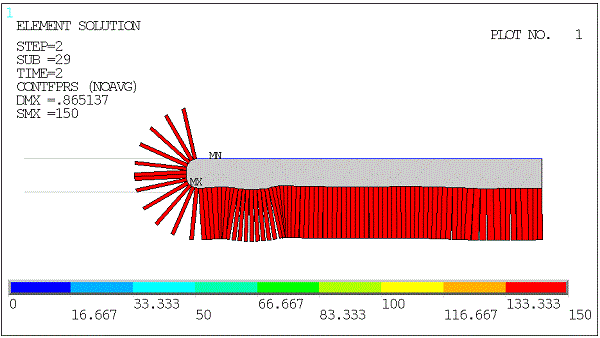
At the end of the first load step (compression load step) most of the contact is closed as shown in the above figure. Plots of contact fluid pressure at an intermediate substep of load step 2 and at the end of load step 2 are shown in Figure 4: Intermediate Fluid Pressure Distribution and Figure 5: Final Fluid Pressure Distribution.
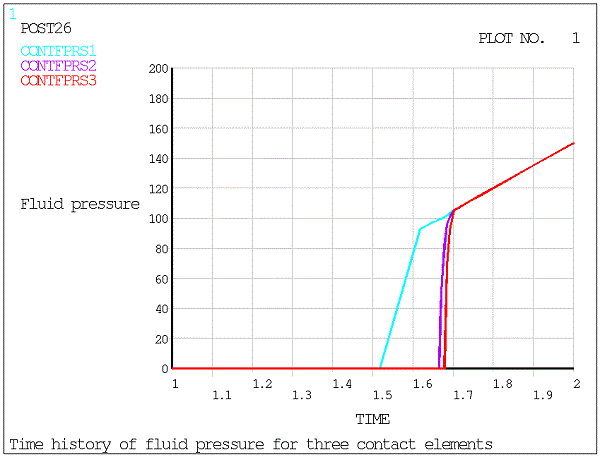
Three contact elements at the bottom of the seal are used for time history postprocessing, representing each region that undergoes fluid penetration. Time history results for fluid contact pressure and gap are printed and plotted to show the path of fluid penetration along the bottom contact elements. The fluid pressure history is shown in Figure 6: Time History of Fluid Pressure for Three Contact Elements.


