In this example, a 30m x 30m x 22.5m box with 7.5m above the water level (z = 0m) was modeled in a hydrodynamic diffraction analysis.
The following conditions exist:
The diffracting elements are 3m x 3m.
Waves are defined in eight directions and four frequencies (0.031, 0.5, 0.97, and 1.43 rad/s).
Forward speed and hydrostatic pressures are not included.
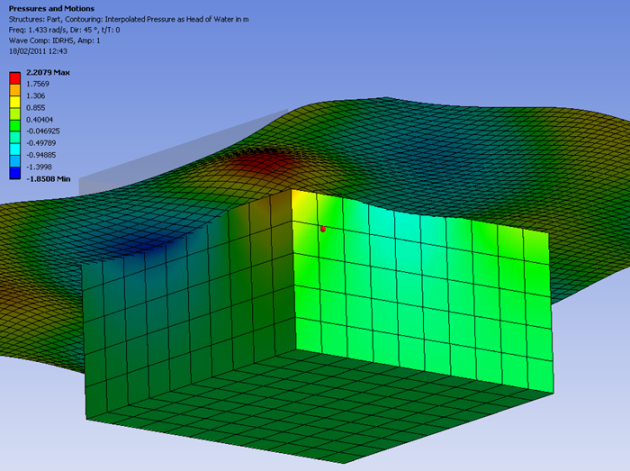
The pressure results from the hydrodynamic diffraction analysis are 45°, 1.43 rad / s, t / T = 0, as shown in the following figure:
The diffracted wave loading data in the analysis_1.ahd file is imported (OCREAD) and applied to the structural model for further analysis, as shown in the following example input:
/verify,difwaveeg
/FILNAME,difwaveg
/prep7
/TITLE,difwaveeg, EXAMPLE FOR AQWA LOADING
/com **************************************************************************
/com SHELL MODEL OF A HOLLOW BOX TUBE
/com CREATED 20/05/10
/com **************************************************************************
antype,static
nlgeom,off
! define shell section
sectype,11,shell
secdata,0.1
! define ocean
matwat=2
idwat=2
idcur=3
idwav=4
depth=250.0
! define geometry
/prep7
!wpoff,,,-15
k,,-15,-15,-15
k,,15,-15,-15
k,,15,15,-15
k,,-15,15,-15
l,1,2
l,2,3
l,3,4
l,4,1
k,,-15,-15,0
l,1,5
k,,-15,-15,7.5
l,5,6
adrag,1,2,3,4,,,5,6
a,1,2,3,4
! Mesh
et,1,181
type,1
mat,1
secnum,11
esize,1
amesh,all
et,2,154
keyopt,2,4,1
keyopt,2,8,idwat
r,2
rmore,0.0001
type,2
mat,1
real,2
esurf
! steel material properties
MP,EX,  1,2.1e11
MP,PRXY,1,0.3
MP,ALPX,1,0.0
MP,DENS,1,7800.0
! water density
mp,dens,matwat,1025.0
! supports
d,  1,ux
d,  2,ux
d,977,ux
d,497,ux
d,  1,uy
d,  2,uy
d,977,uy
d,497,uy
d,  1,uz
d,  2,uz
d,977,uz
d,497,uz
finish
!
/SOLU
! CASE 4 H=1 T=4.384199 PH=0 D=45
acel,0,0,9.8
! ocean
octype,basic,ocean1
ocdata,depth,matwat
!!  diffracted wave
octype,wave
ocdata,8,45.0
octable,1.0,200,0.0
!
!!  ocread to read in external data file
ocread,analysis_1,ahd
!
! list all
slist,all
oclist,all
!! apply inertia relief
!! irlf,1
NSUBST,1,1                     ! 1 SUBSTEPS
TIME,1.0
OUTPR,all,1
OUTRES,all,1
solve
finish
/post1
etable,x,smisc,13
pletab,x,avg
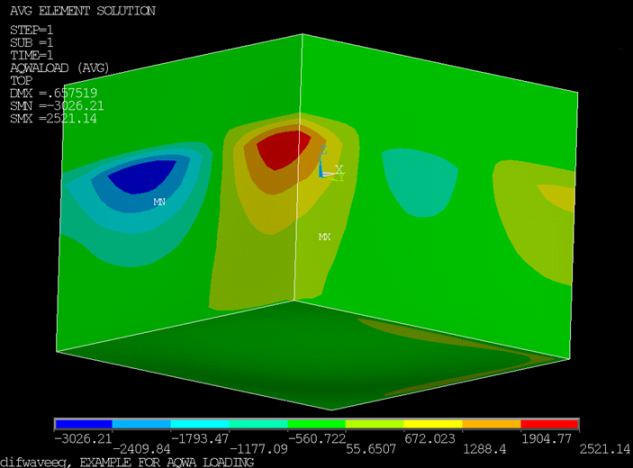
The following figure shows the analysis results using the pressures from the diffracted wave: