Validation of the microstructure solver for each material is performed by comparing experimental and simulation results for various sets of process parameters. Several cubes are printed using a Selective Laser Melting method with various process parameters. After analyzing porosity data, samples are selected that result in high density. These samples are prepared using the standard metallography procedure for EBSD (Electron Back Scattered Diffraction) analysis for grain size and grain orientation estimation, which consists of grinding and polishing the surface of the cubes up to 0.05 µm surface finish. The prepared samples are subjected to SEM (Scanning Electron Microscopy) equipped with an EBSD detector to generate the grain orientation and grain size data. Simulation results are generated by running the simulation end-to-end from thermal solution to microstructure solution using the same process parameters as in the experiments.
Overlap Coefficient Analysis of Grain Sizes
To validate simulated microstructures against experimentally retrieved results, one essential aspect to compare is grain size. Since the grain sizes of microstructures built under the SLM process show significant variability, it may be insufficient to only compare the grain size average for validation purposes. Another comparison technique is to represent grain size distributions as a normal/Gaussian distribution and subsequently use the overlap coefficient to measure the overlap, or similarity, of grain size distributions between simulated and experimental results.
The overlap coefficient is a coefficient ranging from 0 – 1 and can be conceptually understood as the fraction of overlap shared between two distributions. A value of 1 indicates perfect similarity, or exactly similar distributions, and a value of 0 indicates complete dissimilarity between two distributions.
Calculation Procedure
From experimental and simulated results, calculate the average,
 , and standard deviation,
  , of the grain size:
Experimental →

Simulation →

Note: An assumption has been made that these grain sizes are distributed normally. This has been observed empirically, but future improvements can be made to distinguish between two arbitrary distributions.
Calculate the x-positions of the intersections between two distributions:
Calculate the overlap coefficient:
where D is the standard normal distribution function defined as:


Example of Validation Data
A representative example of validation data is provided here for the IN718 alloy. Similar work is done for every material that is available for Microstructure simulations. Note that microstructure results may change as solver refinements are made in subsequent releases.
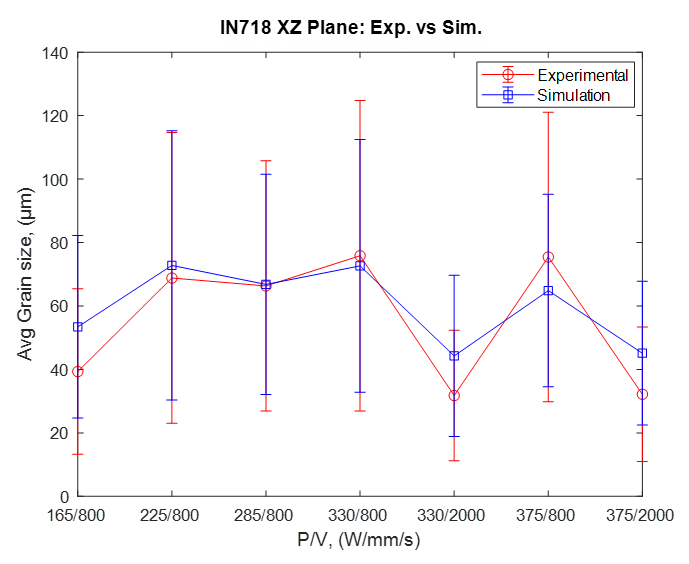
For the IN718 alloy, seven samples were selected. The following graph shows the comparison between experimental and simulated average grain size along with its variability values. The grain size obtained from EBSD analysis was from one of the vertical planes of the cube, therefore, the simulation result is compared with one vertical plane of the cube.
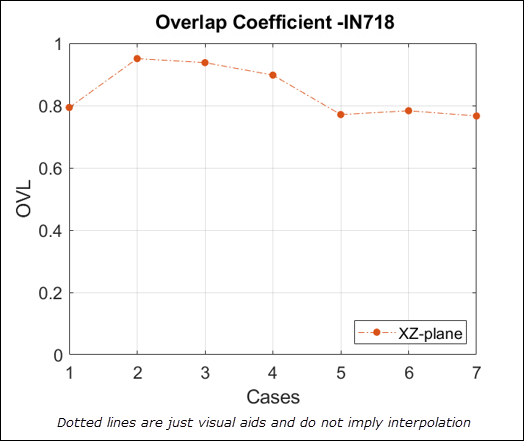
Following is the corresponding plot of overlap coefficient for the seven samples.
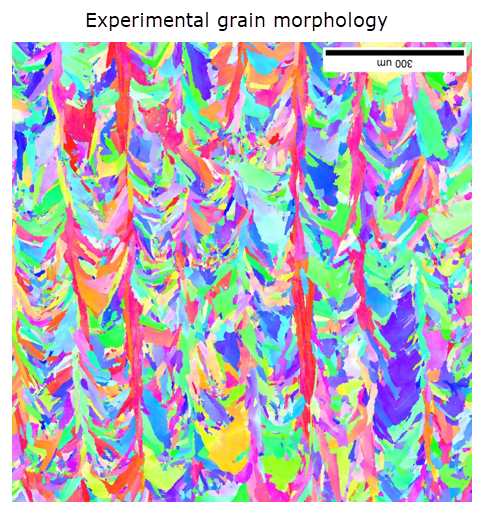
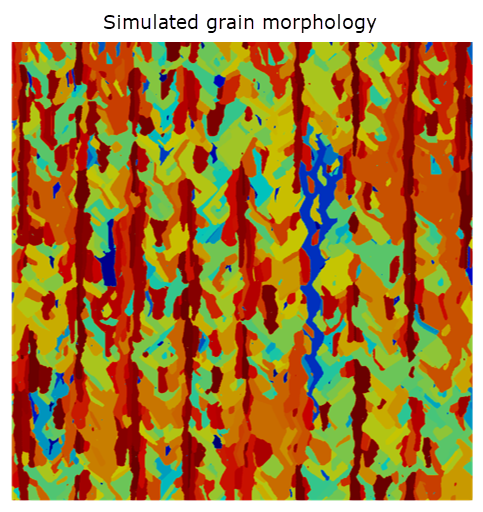
In addition to grain size validation, the grain morphology is also validated by comparing simulation results with experimental results. Specifically, we examine how the grains are oriented in a sample frame of reference. An example comparison of grain orientation is shown below. (The experimental results image is shown upside down to ensure consistent viewpoints; they are both aligned with the build direction.)