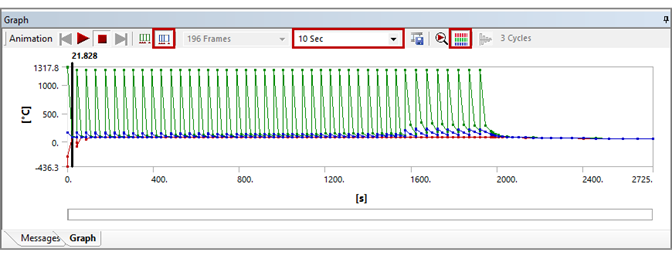
Once a solution is available you can view contours of the results or animate the results. You will have solutions at many time points and you can display the variation of the result item at a location over the build history.
Typical result items of significance are temperatures in the Transient Thermal solution and displacements and equivalent stress in the Static Structural solution.
Procedural Steps
Recall that you used Output Controls under Analysis Options to control which items are solved for in the simulation. You also may have set up results trackers in the solution step to observe the results being processed during the solution. When reviewing results after the solution, you will generally need to evaluate results to obtain them for viewing. Evaluating results is a way to retrieve them from the data that was stored during solution. Only data items that were solved for may be retrieved in this way.
There are many different ways to view results but some of the ones most commonly used for additive manufacturing are described here:
Animate Thermal Results - Temperatures
In the project tree under Transient Thermal, select the Solution object and then, in the context menu, click Thermal and then Temperature. Or right-click Insert > Thermal > Temperature. A Temperature object is created and becomes active.
Right-click Temperature and select Evaluate All Results. This retrieves the temperature data and displays it in both graph and tabular form.
Use the animation controls at the top of the Graph window. Click the Result Sets button
 and also the Update Contour Range at Each Animation Frame button
 . Adjust the
number of seconds for the animation and click Play. For more information about animation controls, see Animation in the Mechanical User's Guide.
Animate Structural Results - Total Deformation
In the project tree under Static Structural, select the Solution object and then, in the context menu, click Deformation and then Total. A Total Deformation object is created and becomes active.
Right-click Total Deformation and select Evaluate All Results. This retrieves the deformation data and displays it in both graph and tabular form.
Use the animation controls at the top of the Graph window.
It is important to change the magnification scale of the display in the geometry window so you can get a true sense (or an exaggerated sense) of the deformation in your build. With Total Deformation highlighted in the project tree, from the Result context tab, select the True Scale option from the drop-down menu. Animate the results using the animation controls. Select other scales from the drop-down menu to see exaggerated results.


