


On the Editor Toolbar, the drop-down menu of the Run Script button includes the action. This action starts executing script using the debugger in the Mechanical Scripting pane. Actions for this feature includes:
Inserting Breakpoints
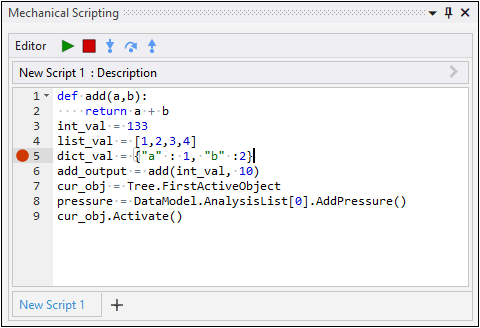
You can set breakpoints by selecting the field next to the line numbers (a red circle icon is displayed).
Important: Breakpoints pause the script execution. When paused, you cannot interact with the Mechanical user interface.
- Exceptions
If there is an error in the script, an exception is thrown and a message displays describing the exception. Once you navigate from the message window, the line that includes the error is highlighted with a marker next to the line number. When you hover over this marker, you can read the description of the exception again.
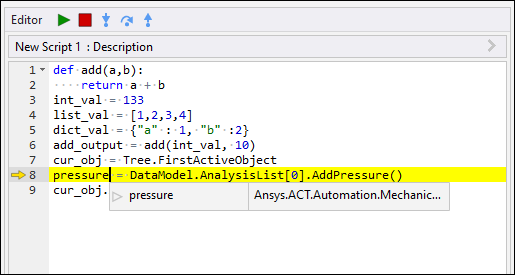
When a script is run using the debugger and breakpoints have been inserted. The script will pause at the breakpoints as it executes. You can then use debugging toolbar actions to proceed. The current line of execution is highlighted in yellow, and an arrow is shown next to it.
Using the Actions of the Debugging Toolbar
Selecting the button displays the following debug toolbar.
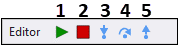
Toolbar actions include:
Run Script/Continue (F5): Continue execution to the next breakpoint when script is paused or re-start the debugging.
Stop Debugging: Exit debug mode.
Step Into (F11): Pauses at the first line of the function you are stepping into.
Step Over (F10): Execute the currently selected function or statement and then step over to the next line.
Step Out (F12): Continue execution to the next breakpoint or the next line after the function returns.
Note: The availability of toolbar actions changes based on the current state of the debugger.
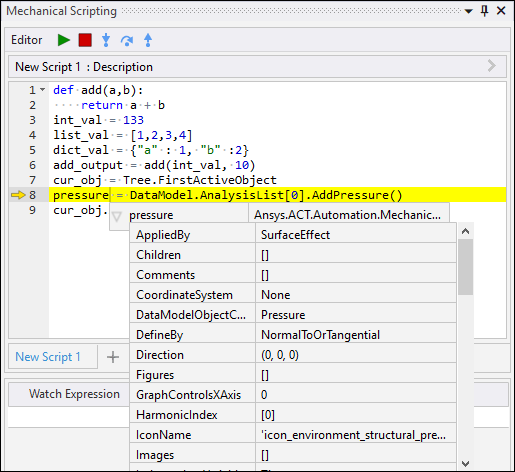
Displaying Inspection Tooltips
The inspection tooltip allows you to inspect variables when you are paused at a breakpoint. You can use the inspection tooltip by hovering over a variable. If a variable has additional properties, you can use the arrow beside the variable to display a drop-down table of the properties and values.
 |
 |
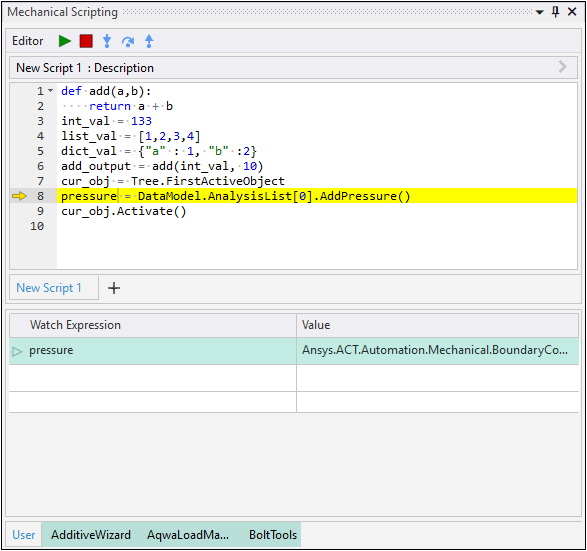
Examining Expressions using the Watch Window
When a script is run via the debugger, a watch window displays below the editor. To use this window, the editor must be paused at a breakpoint. The window enables you to enter an expression in the Watch Expression column evaluate expressions and "watch" their values change as you step through your script. Place the cursor in the Watch Expression column to enter and/or delete entries. Use the [Tab] key to execute your entries.
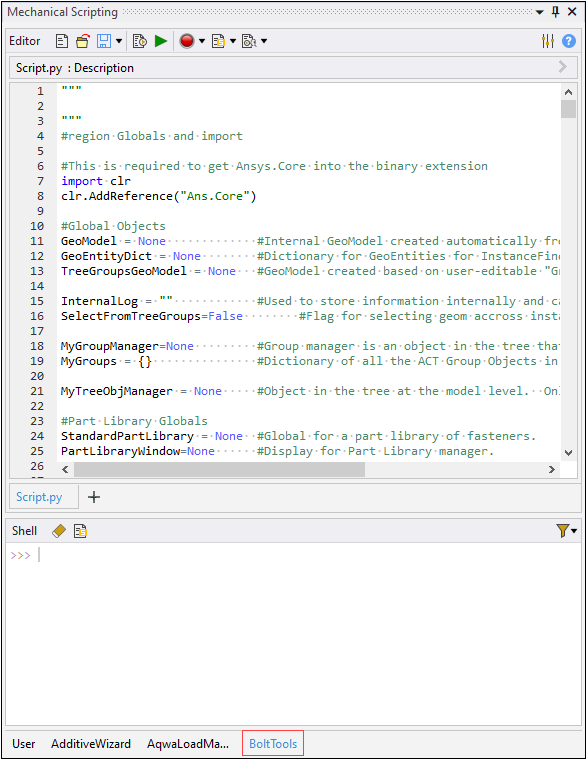
Viewing Debug Extensions
When you turn debug mode on in Workbench, you can use the same debug feature available in the Mechanical Scripting pane to debug extension python scripts. When you turn the feature on, you see the extension tabs at the very bottom of the Shell pane.
Debugging features are the same when working with an extension. Simply switch to the appropriate extension tab in the scripting view and you will see all python scripts in the editor. The only difference is, because extensions work based on callbacks, breakpoints are not encountered until you perform an action in the interface that executes the callback.
Important: If you change the script of an extension, you must save and then reload the extension before rerunning/running the debugger. The application will prompt you to save the file if you make and change and then run the debug tool. However, if you make a change and select the Save button. You must also reload the extension using the Reload button in the ACT Development group on the Automation tab.
Debugging Limitations
If you run the command import os in the debugger, an exception is generated. To avoid this issue, you first need to turn
on the Debug Mode option in the Extensions category of the Workbench Options
dialog available through the Tools menu. Once selected, you need to execute the command using button.
Following this you can use the debugging feature without producing an exception.