


Managing Curve Results
For some indicators, such as indicators vs time, the results are curves.
Displaying Curves
If you compute indicators whose results are curves, click Display in the Results table to open the resulting curve(s) in separate window(s).
If you want to automatically display the curves when calculation is completed, check Automatically display the curves when calculation is completed.
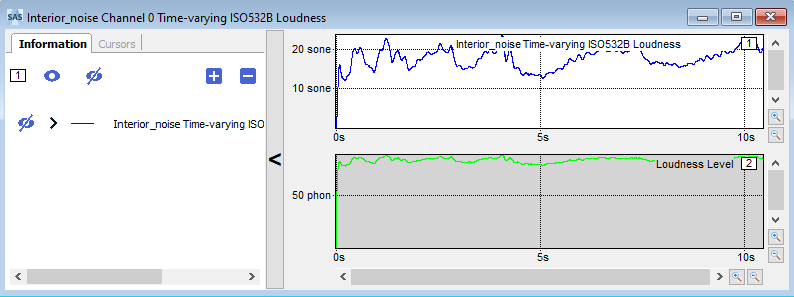
Displaying Several Curves in a Same Window
- Display the curves corresponding to the indicators that you want to display in the same window.
In the curve window in which you want to add another curve, click
 .
.The Add signal to this window dialog opens.
- In the Add existing signal panel, select the Source signal, that is to say the curve you want to add to a new block of another curve window.
- In Destination, tick Add to a new block and
set a name for the new block.
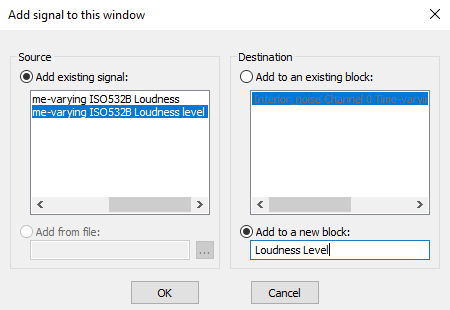
- Click OK.
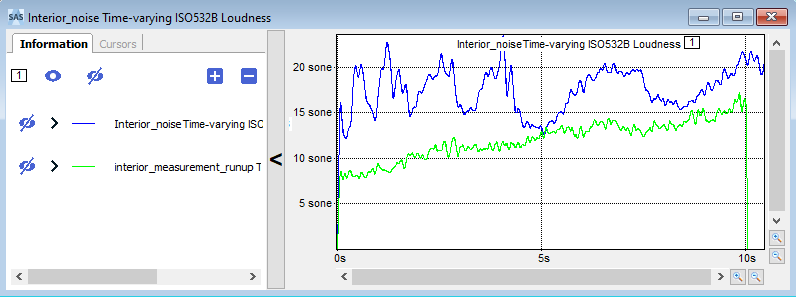
Displaying Several Curves in a Same Block
After computing the same indicators for different signals, if you want to overlay several curves in the same block of a curve window:
- Display the curves corresponding to the indicators that you want to display in the same window.
In the curve window in which you want to add another curve, click
.The Add signal to this window dialog opens.
- In the Add existing signal dialog, select the Source signal, that is to say the curve you want to add to another curve window.
- In Destination, tick Add to an existing block
and select the block to which you want to add the curve.
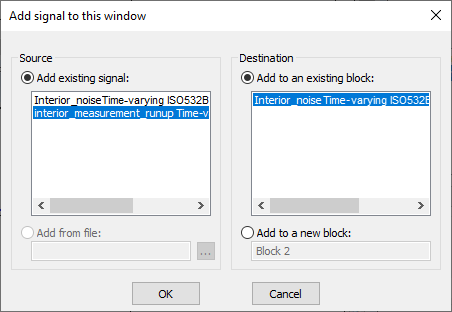
- Click OK.
Changing the X Axis
- Click Display to open in a new window the curve corresponding to the indicator you want to observe according to a specific factor.
- Right-click the curve.
- Click Change X axis, then select the unit to set as abscissae.
The unit of the curve's X axis is changed. You may be able to identify synchronous events and explain perception changes in relation to the selected abscissa.