Prerequisites: The Dataset Coverage dialog is displayed once you have loaded a series of data files
when creating a harmonics or broadband noise model using two control parameters.
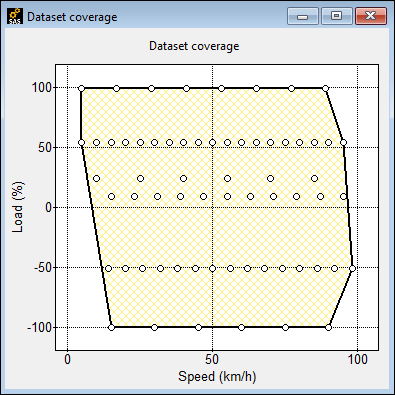
The following information is available of dataset coverage graph:
The x and y axes are labelled according to the names you supplied for control parameter
1 and 2 when creating the dataset.
A yellow-shaded area bounded by a solid black line shows the range of data within which
you can define a valid trajectory for the 2-parameter source.
Hover over any of the points on the graph to display a tooltip giving the x and y
values of that point, along with the name of the data file from which it was loaded.
Click any of the data points to create a persistent tooltip on the coverage
display.
Double-click any point to display the individual spectrum or set of order values for
that data point.
Display/hide the dataset points
Display/hide the trajectory
Switch the x and y-axes
Access the following functions from the View menu on the main
menu bar: