Calculating a Spectrum
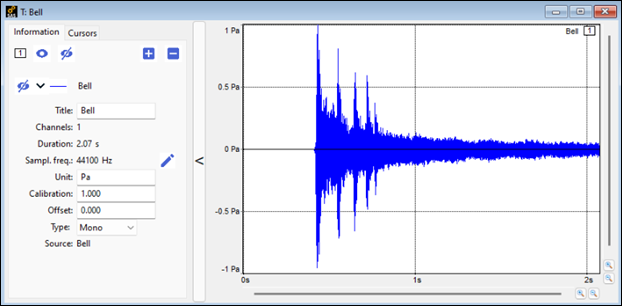
This section describes how to calculate a spectrum (level vs frequency in Hz) from a temporal signal.
To Calculate a Spectrum:
-
Click .
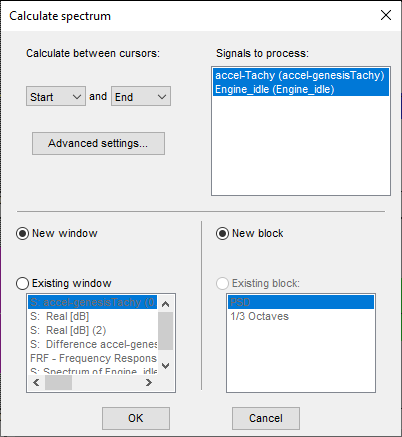
The Calculate spectrum window is displayed.
 Tip: Using calculates the spectrum of all the signals in the block using the default parameters set in the software preferences, and then displays this in a new window.
 -
If you want to access and modify the spectrum calculation settings, click Advanced settings.
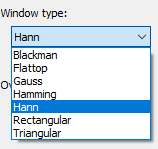
Select the required Window Type from the menu to use one of the standard analysis windows.
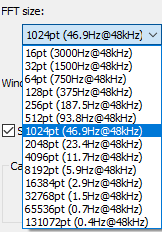
Select the FFT size to use a specific number of samples for the FFT calculation. This number of points corresponds to the number of narrow bands used for the FFT analysis.
Enter an Overlap value to specify the overlapping ratio (in percent) between successive signal slices on which the spectrum is calculated. The higher the ratio, the higher the number of signal slices.

If required, change the Window size. The analysis window size cannot be greater than the FFT size.
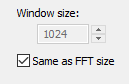 Note: When the Window size is smaller than the FFT size, zero-padding is applied. This means that the analysis window is applied to Window size samples of the signal, and then a number of zero samples are appended to match the size of the FFT samples. The FFT is then calculated on this "zero-padded" vector of samples.Tip: Select the Same as FFT size option to use the same number of samples for the FFT and for the analysis window. This is the recommended setting.
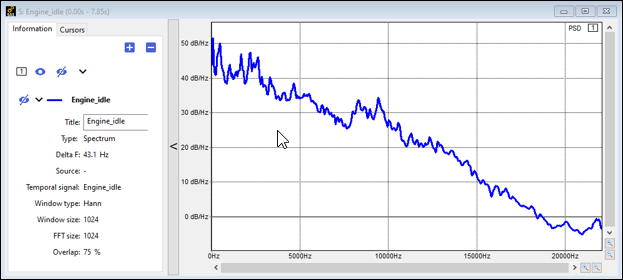
The Spectrum is calculated and displayed in a new window. The Spectrum type used for the display is the one set in Managing Spectrum Settings.