Results Analysis
Once every sets have been measured and all values reported in the CharacProcess excel file, the data is automatically computed to give you a full report of the display characteristics.
In the Summary tab, charts sum up the analysis made and the characteristics of the display.
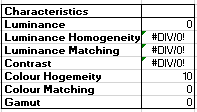
Characteristics
The Luminance corresponds to the native luminance of the display. This table is useful to know the power of the screen and if it can display a lot of luminance in a small area. It indicates the maximum white luminance the screen can display, the average white luminance of the screen and the pixel size needed to reach 85% of the maximum luminance.
The Luminance Homogeneity provides information about the display homogeneity for every native color: white, red, green, blue and black. The closer to 100% the better the homogeneity is.
The Contrast provides the global contrast (commercial contrast) of the display, that is the ratio between the maximum luminance and the minimal luminance of the display. And the local contrast corresponds to the contrast in a scene where there is black and white displayed at the same time.
The Native Gamma Matching gives the closest gamma curve value to the display's native gamma.
The Luminance Matching Labs gives the error between the luminance supposed to be displayed by the screen and the one actually displayed. In the Luminance Matching Labs tab, graphs better illustrate this error margin.
The Color Matching in VP and VR Labs table gives the error (ΔE) between the color supposed to be displayed by the screen and the one actually displayed. It also gives the native white temperature of the screen (that should be around 6500K for the best results).
The Gamut gives the size of the display's native gamut compared to the classic sRGB gamut.
Rating
The second chart gives a rating of the display's characteristics on a scale of 10. A rating system has been established so that the characteristics can be easier to read and to compare with other displays.
For more information about this rating system, see the RatingSystem tab.
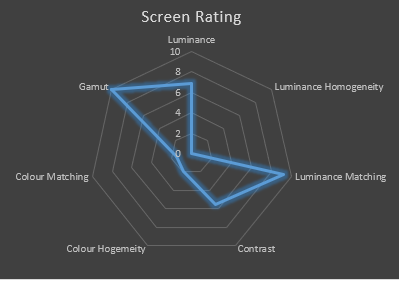
Screen Rating Summary and Graph
The last chart gives the average rating for each characteristic of the display.