


Managing the Display
- If you want to move the map, click and move the mouse at the same time.
- If you want to make a vertical or horizontal symmetry of the map, click Operation, Vertical axis symmetry or Horizontal axis symmetry.
-
If you want to use the zoom, rotate the mouse wheel, click Edit, Activate Zoom or click
 and then left-click or right-click.
Click
 to display the original size in pixels.
When moving the mouse over the map, values at the position are displayed in the status bar.
- If you want to view spectrum curve at the mouse position, click
 .
. -
If you want to modify the number format, right-click the status bar.
The number format is the number of decimal per value.
- If you want to modify the unit according to the map type, click View, Photometric units or Radiometric units.
- If you want to modify the axis unit of displayed values, right-click the status bar.
-
If you want to change displayed colors, use the color list.
Iso levels displays the image with ISO curves or surfaces.
- If you want to display Wavefront Error or FFT MTF or PSF, use the Wavefront Error list.
- If you to change displayed field, use the field list.
- If you want to display one single wavelength, use the wavelength list.
If you want to display grids and other options, right-click the map to select tools.
As an example you can show ruler, set ruler parameters, show axis on cross, snap cross to grid, show tooltip, show gray around the map, fill shape, show primary or secondary graduations, set graduations parameters, show primary or secondary grids, set grid parameters, show the flux, the minimum and its position, the maximum and its position.
Note: When opening a *.lpf, in the XMP the first measure area from the Measures tool is displayed on the first opening. The selected measure area (in the Measure tool) upon save is displayed on the next openings. If you activate Show tooltip, two tooltips will be displayed:- One tooltip corresponds to the coordinates information and the value (depending on the map's unit) of the pointed pixel on the map.
- One tooltip corresponds to the measure value selected in the Measure tool for the displayed area.
When opening a XMP (out of the Light Expert context), if you activate Show tooltip, the tooltip will display the coordinates information and the luminance of the pointed pixel on the map.
-
If you want to change the observer point of view in an Intensity map, in the View tab, select:
This option is only available for intensity sensors with an XMP format and with an orientation different from Conoscopic.
| From source looking at sensor: The viewing direction of the observer is the same as the light direction emitted. | 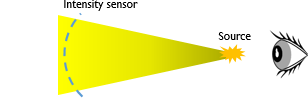 |
| From sensor looking at source: The viewing direction of the observer is in the opposite of the light direction. | 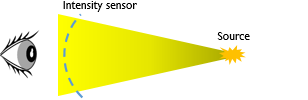 |
-
To modify the display's parameters, click Level
 .
.You can select a level to modify the value. Press Enter to validate the change.
You can right-click and selectCopy to clipboard.
When modifying minimum or maximum value, you can check Intermediate levels auto-update to compute all intermediate values. The minimum and maximum levels are set according to the minimum and maximum luminance detected in the map.
If needed, you can add
 or delete
  a color level.Note: Adding or deleting a level on the current scale changes the color threshold of each level as it depends on the number of level added.
 - You can normalize the map to a specific value:
- Create a measure to find the maximum luminance of the map.
Make the following division: Maximum Luminance / Normal Reference Value
The result corresponds to the Value to enter in the Level tool.
Note: If you want to normalize to 1, only enter the Maximum Luminance in the field Value.
-
Click Default to cancel all modifications.
Check IsoCurve to display the contour lines on the iso levels.
Check Filled to display only the contour lines without the iso levels. The contour lines are then colored according to the corresponding scale level.
Click Linear or Log to switch between a linear or logarithmic scale. Click Load Scale or Save Scale to load or save parameters in a scale file. Format is .scl.
- When Iso levels, Black to Color (Custom) or Black to White (Custom Color) is selected in the color list, you can click
 to change the color(s) to display in the Level.
 - Click 1:1 Scale to use the White Point Luminance value specified in the Monitor tab of the Preferences as a default value for the scale. This allows you to have a 1:1 scale for the luminance map where values are below the maximum screen value.