


Data Sets Description
Data Sets
6 Data sets are required to correctly characterize the monitor. Each set is targeting a different characteristic of the monitor.
Set 1, 2 and 3 are measurement sets used to characterize the display in its native mode (on Windows settings) and give an overview of the display capacities. The analyzed data will allow to optimize the rendering of Speos results.
Set 4 and 5 are measurement sets are used to characterize the display with Ansys software.
Description
Set 0
Set 0 contains a white background useful in the first stages of the screen characterization.
Set 1: Saturated colors (5 bmp files)
 |
 |
 |
 |
 |
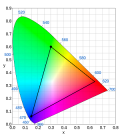
This set allows you to determine the global contrast, the luminance, the luminance homogeneity, the color homogeneity and the native WRGB xy color coordinates to create the display color gamut and to know which colors can be displayed.
Set 2: Black and white checkerboards and pixels (8 bmp files)
 |
 |
 |
 |
 |
This set allows you to determine the local contrast and the minimal pixel size needed to reach 85% of the maximum luminance of the display.
Set 3: Gamma maps (4 bmp files)
 |
 |
 |
 |
This set allows you to determine the native gamma of the display and then fill the Preferences of Speos Labs.
The gamma of a display refers to its brightness response. When not properly set, images can appear bleached out or dark.
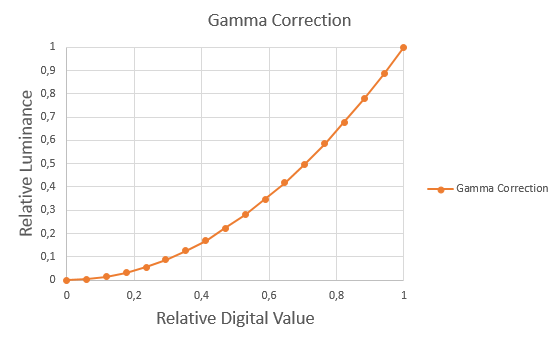
The gamma complexity is of two principal causes:
Human perception of the color or brightness intensities does not have a linear relationship. For example, the human eye is more sensitive for green colors.
The brightness of image display devices does not have a linear relationship with its voltage input.
Luckily, the native gamma of displays is usually between 2 and 2.6, the gamma of the human eye is the inverse of a 2.5 gamma so only a small correction must be applied depending on the display.
Set 4: Color checker file (xmp file)
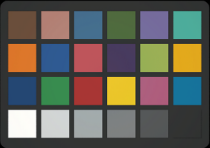
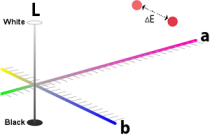
This set is useful for determining the color matching of Speos Labs on the display. The xyY of each square in the color checker are known and can be displayed on a color gamut (cf. fig.1). The Lab color coordinates (another color space) can be deduced from those ones and the difference between the color checker and what is displayed can be characterized by the ΔELab.
 |
|
Lab color space and DeltaE Lab |
Set 5: Gradient charts (xmp files), spectrum files and an excel file

This set is useful to determine the luminance matching of Speos Labs on the display.
For a realistic rendering, it is important that the luminance displayed by the screen is the same as the one displayed in a simulation. The perfect display would be able to display 1:1 luminance.